")
Our First-Time Donor Research Report aims to shed light on a particularly important group—first-time donors—and to provide a comprehensive overview of what happens after they make their initial contribution. The landscape of higher education fundraising is constantly evolving, and understanding donor behavior is critical for institutions seeking to maximize their philanthropic potential.
In this report, we take an in-depth look at first-time donors in higher education, offering a clear picture of what happens after they make their initial gift. We’ve analyzed data from 275,000 donors across 50 schools to explore how these individuals engage with their alma maters over time. You’ll find benchmarks for “typical” donor behavior, so you can see how your results stack up. Plus, we’ve included some practical tips to help boost donor engagement and a sneak peek into the next phase of our research, where we’ll continue tracking this important group.
Why Focus on First-Time Donors?
Understanding how first-time donors behave, what motivates them, and how to encourage their continued support can transform a one-time gift into a lifetime of giving, helping institutions not only meet their fundraising goals but also cultivate a community of dedicated supporters. This report sheds light on these crucial aspects and offers insights for enhancing donor stewardship.
According to Lynne Wester of Donor Relations Group (DRG), first-time donor retention rates linger at just 20% (our research validated this, with donor retention rates at 24%), making the likelihood of turning an initial gift into sustained support slim. This means it’s essential for institutions to rethink their approach. Studies show that acquiring a new donor costs seven times more than retaining an existing one, yet our research found that nearly 62% of first-time donors don’t give again within three years. These statistics highlight the importance of engaging new donors promptly and meaningfully to increase the chances of repeat giving.
Retention isn’t just about dollars; it’s about relationships. Investing in first-time donors is not only more cost-effective than acquiring new donors but also essential for building a sustainable donor base. By valuing all contributions and responding quickly to initial gifts, ideally within the first 30 days, institutions can foster loyalty, ensuring that these donors become long-term champions of the cause. Additionally, research shows that retaining just 10% more donors can boost fundraising revenue by up to 200%, underscoring the significant impact that early and consistent engagement can have.
How to Use This Report
This report serves as a benchmarking tool for higher education fundraising professionals seeking to understand the typical behaviors of first-time donors. It offers a detailed analysis of donor characteristics across various dimensions, such as constituency type and gift size.
The insights presented are intended to provide a clear picture of what is considered “normal” within the industry, offering a basis for comparison and strategic planning. By identifying where your institution matches up or differs from these benchmarks, you can open conversations about potential areas for improvement. This comparison can highlight opportunities to refine donor engagement and management strategies, improve donor retention, and enhance overall fundraising outcomes.
You’ll find key takeaways highlighted throughout, and you can use the contents section below to skip around the report.
This report is packed with in-depth insights, data, and visuals! You’ll want to top up your coffee and set aside some dedicated time to read through it—and don’t forget to take breaks! If you prefer to jump around to the highlights, use the content section below.
Contents:
- Biggest Overall Findings
- Mapping Trends Among First-Time Donors
- Understanding Donor Segmentation
- Constituency and First Gift Size
- First-Time Donor Retention
- First Gift Follow-Up
- Research Framework
If you’re an EverTrue customer and would like additional support in analyzing this information, our team is able to assist.
Biggest Overall Findings
- First Gift amount is usually between $1 and $100: The majority of first-time donors contribute smaller amounts, with 58% of donations falling in the $1 to $100 range. However, the distribution also highlights the importance of non-alumni donors, who are often overlooked but represent a significant portion of larger gifts. The report suggests a need to broaden engagement strategies beyond traditional alumni-focused approaches.
- Major gift prospects receive more personalized attention: Segmenting first-time donors reveals distinct behaviors and opportunities across giving levels. Major Gift prospects, although fewer in number, show a higher likelihood of being engaged in personalized stewardship plans from the outset. In contrast, the “messy middle” of Mid-Level Donors presents a valuable opportunity for institutions to deepen relationships through scalable, technology-driven engagement (an undertaking made much easier with Signal by EverTrue).
- 62% of first-time donors don’t give again within three years: Retention rates for first-time donors are low, with 62% failing to make a second gift within three years. The first year is particularly crucial, as donors who do not renew during this period are significantly less likely to stay engaged. Variations in one-year retention rates across institutions suggest that some are more effective in their follow-up strategies, offering potential best practices for others to adopt.
- Follow-up timing significantly impacts donor retention: The timing of follow-up is a critical factor in donor retention. The data reveals a trend of delayed response times, particularly for smaller gifts, with a median delay of nearly six months. In contrast, major donors receive faster, more personalized attention, underscoring the need for institutions to prioritize quicker, technology-supported responses for all donors.
- Faster follow-up boosts retention rates: Donors who received prompt follow-up after their first gift showed significantly higher retention rates. This reinforces the importance of timely, personalized engagement in converting first-time donors into long-term supporters. The data suggests that reducing response times, particularly within the first 30 days, could further enhance retention rates.
The insights presented in this report underscore the importance of rethinking traditional donor engagement and management strategies. By focusing on timely, personalized follow-up and leveraging technology to manage relationships at scale, institutions can significantly improve donor retention and overall fundraising outcomes. The findings challenge conventional wisdom and encourage institutions to adopt more agile and responsive approaches to donor stewardship.
This report serves as a call to action for higher education institutions to refine their engagement and donor management practices, ultimately fostering stronger, more enduring relationships with their donors.
Mapping Trends Among First-Time Donors
Getting a clear picture of the donor population is key to understanding the results of this study. The diversity among the donors in our research offers great insights into what motivates them and how different engagement strategies can work for different groups.
Majority of First-Time Donors Are “Friends” of the Institution
The donor population in this study is categorized by primary constituency type (as determined by the institutions’ internal CRM systems). Constituency types were prioritized in the following order:
- Alumni
- Parent
- Faculty/Staff
- Friend
This approach makes sure that donors with multiple ties to the institution are grouped based on their strongest connection.
The chart below shows how first-time donors in this study are spread across these main constituency types.
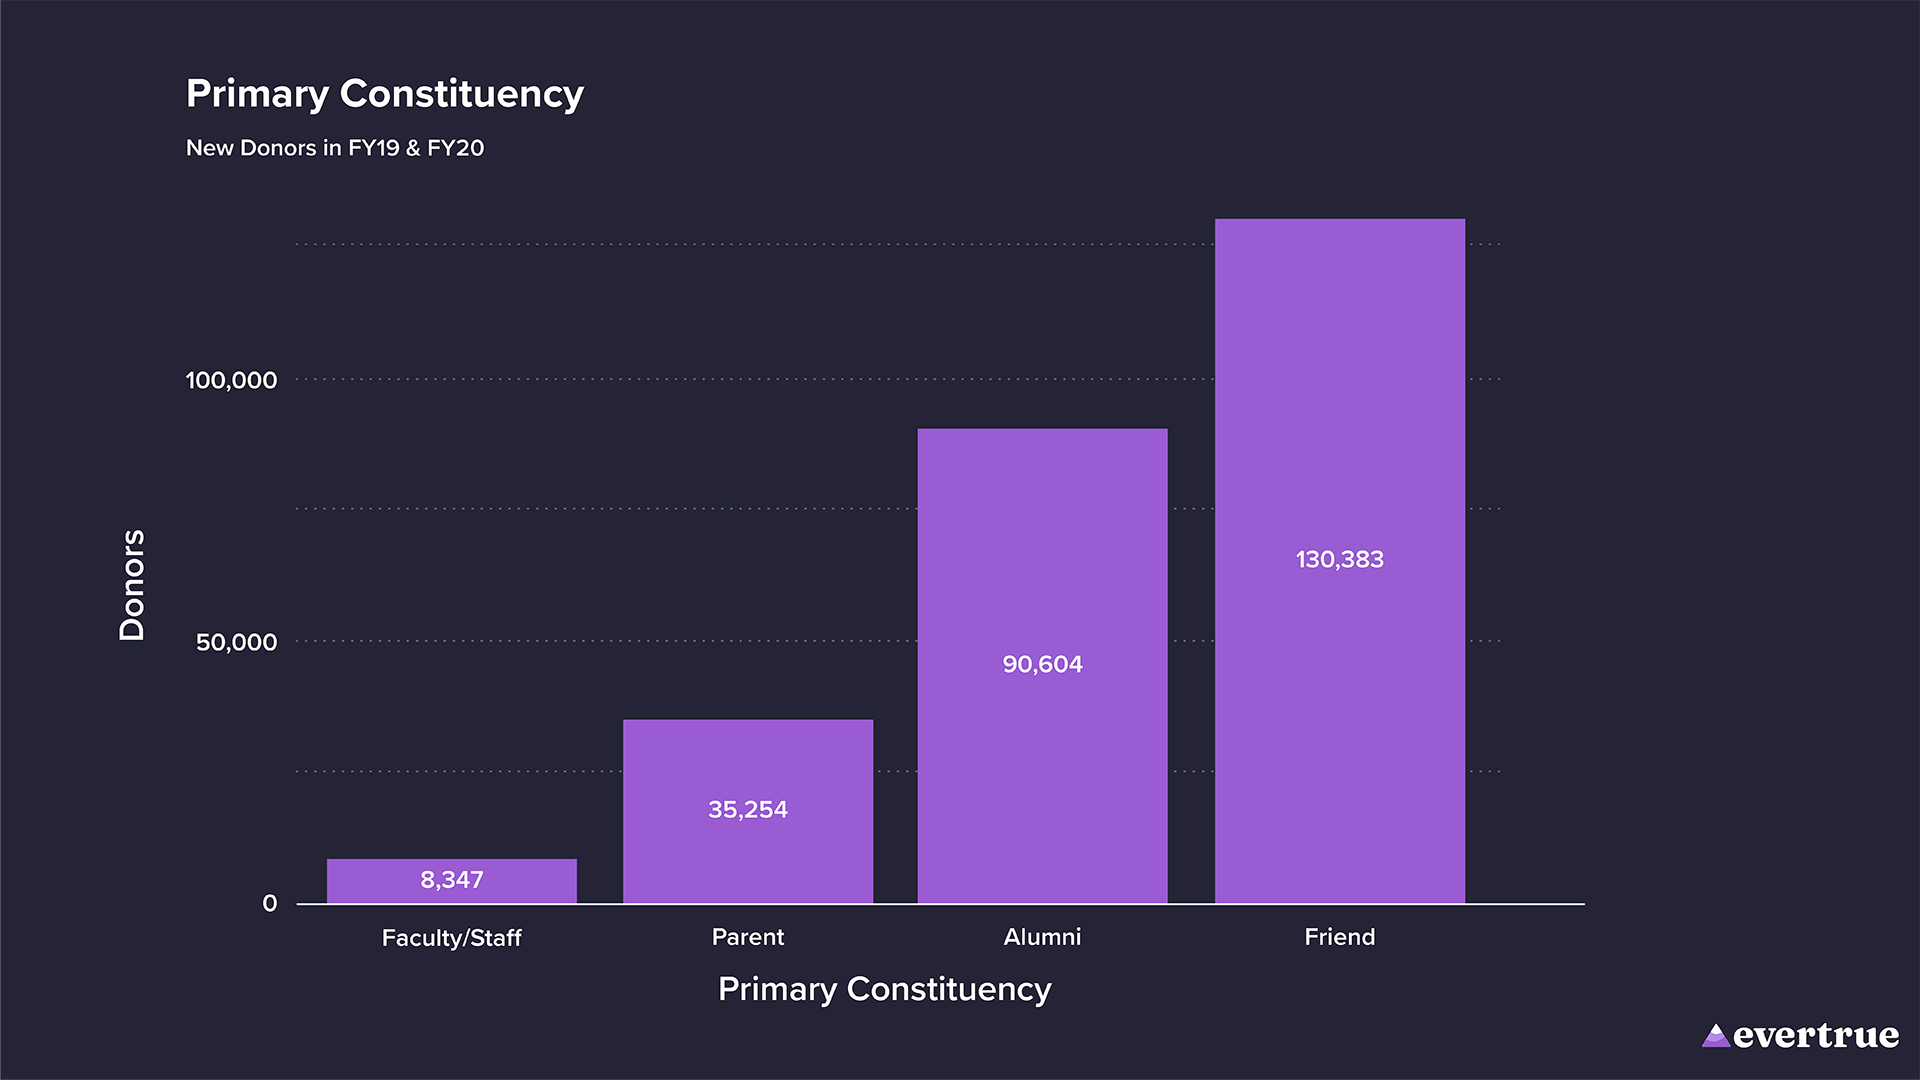
As shown above, the largest group within the population is classified as “Friend,” which includes any first-time donor with a primary affiliation of something other than alumni, parent, or faculty/staff. This group comprises 130,383 donors, highlighting a significant portion of the population that is not traditionally linked to the institution.
Alumni constitute the second-largest group, with 90,604 donors, followed by parents (35,254 donors) and faculty/staff (8,347 donors).
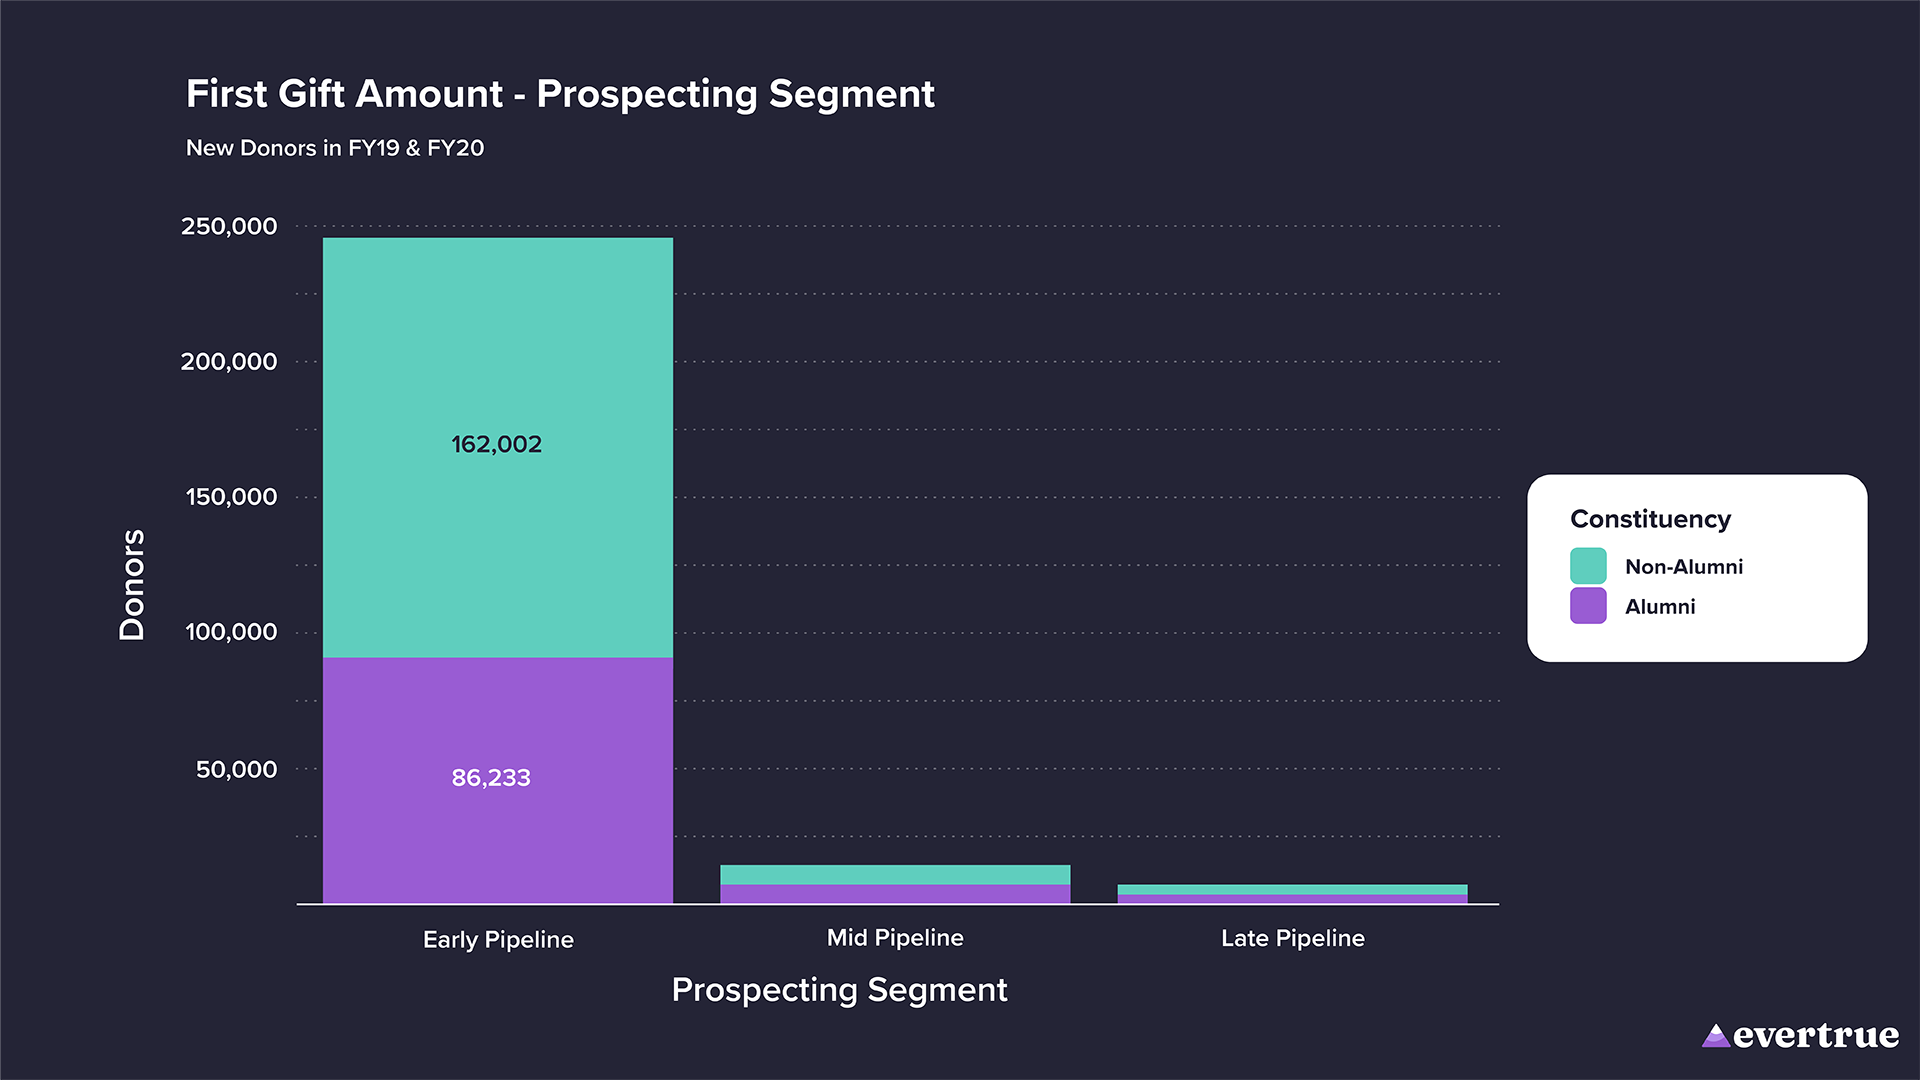
34% of First-Time Donors Are Alumni
The alumni status of donors is a key indicator in higher education fundraising, where alumni are often viewed as the primary donor base. However, our findings challenge this assumption.
The plot below shows the ratio of alumni to non-alumni among first-time donors.
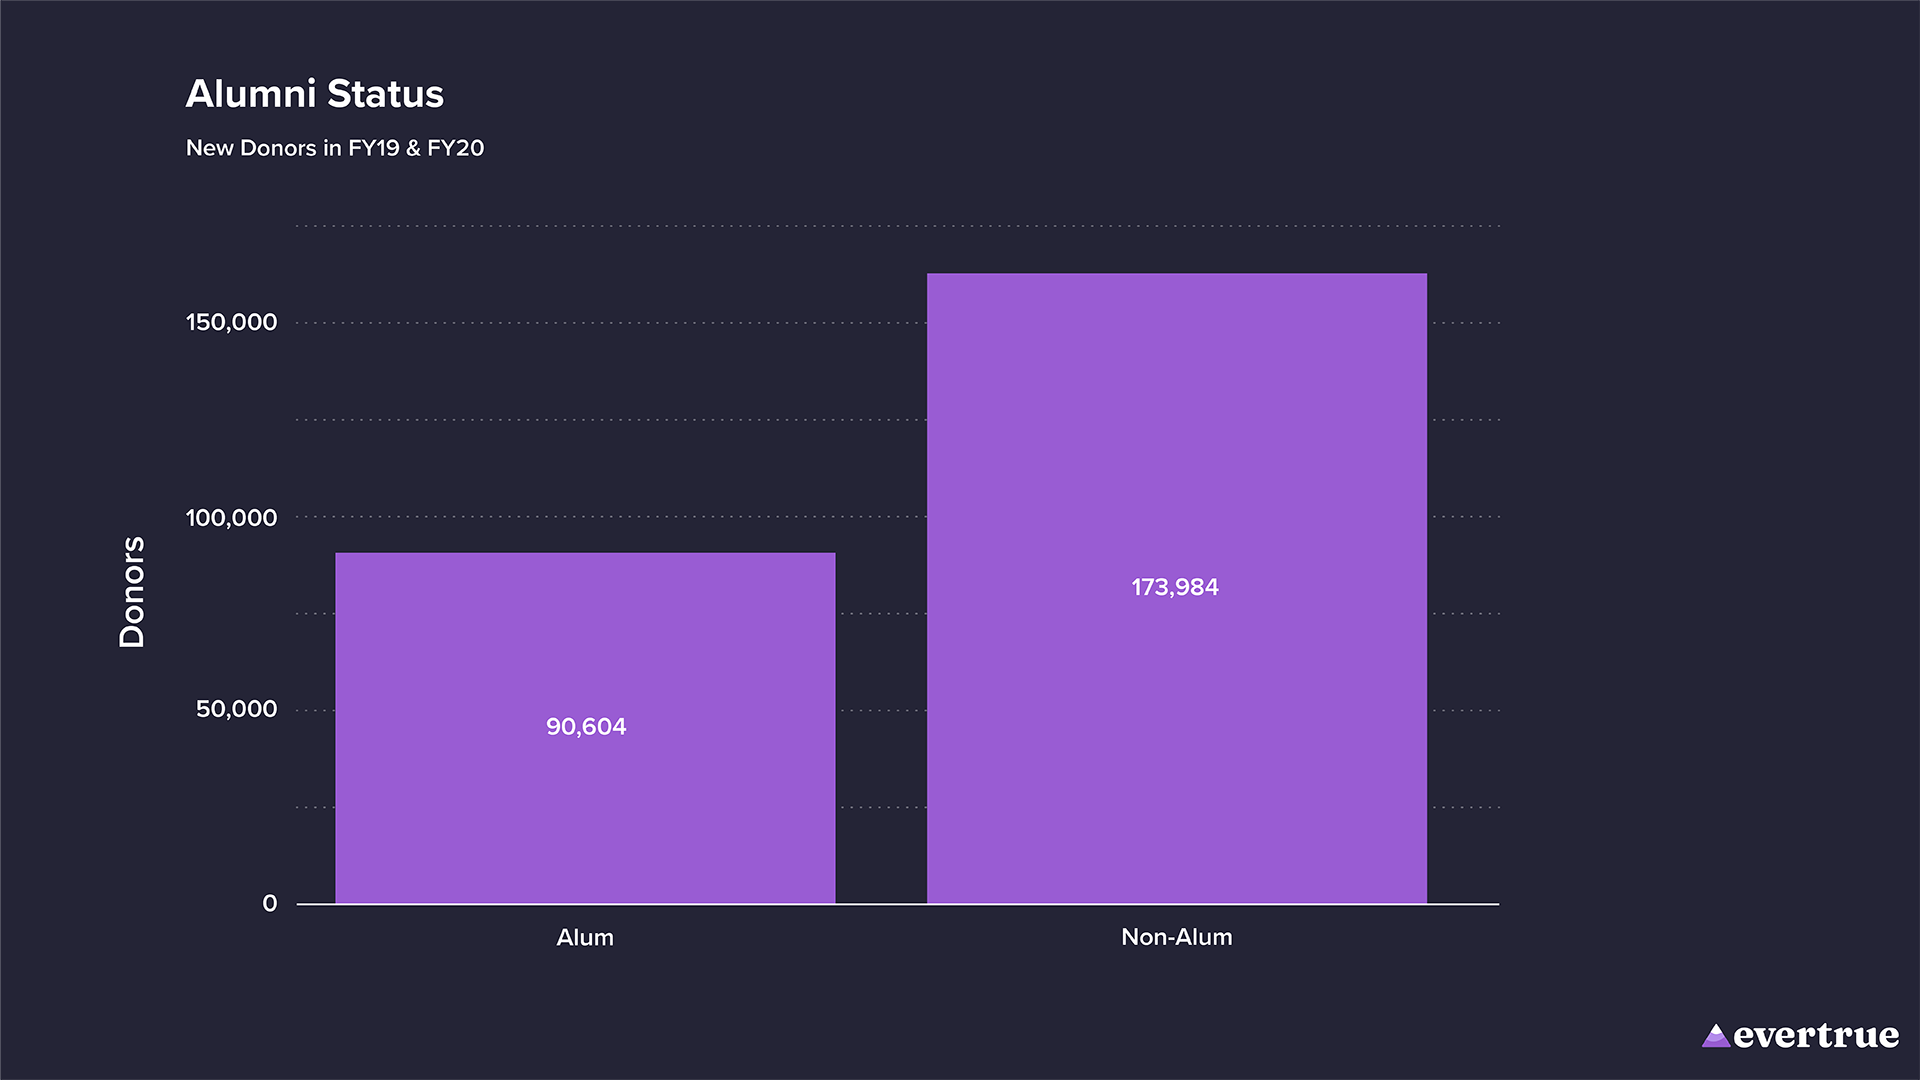
Surprisingly, 66% of the first-time donors in our study are not alumni of the institution, a substantial number given the industry’s typical focus on alumni status. This finding suggests that non-alumni represent a significant and perhaps underutilized donor base, warranting further attention and tailored engagement strategies.
Majority of First-Time Donors Made First Gifts Under $100
The first gift amount serves as an indicator of donor commitment and potential future engagement. Understanding the distribution of these initial contributions provides a helpful perspective on first-time donor behavior and the broader fundraising landscape.
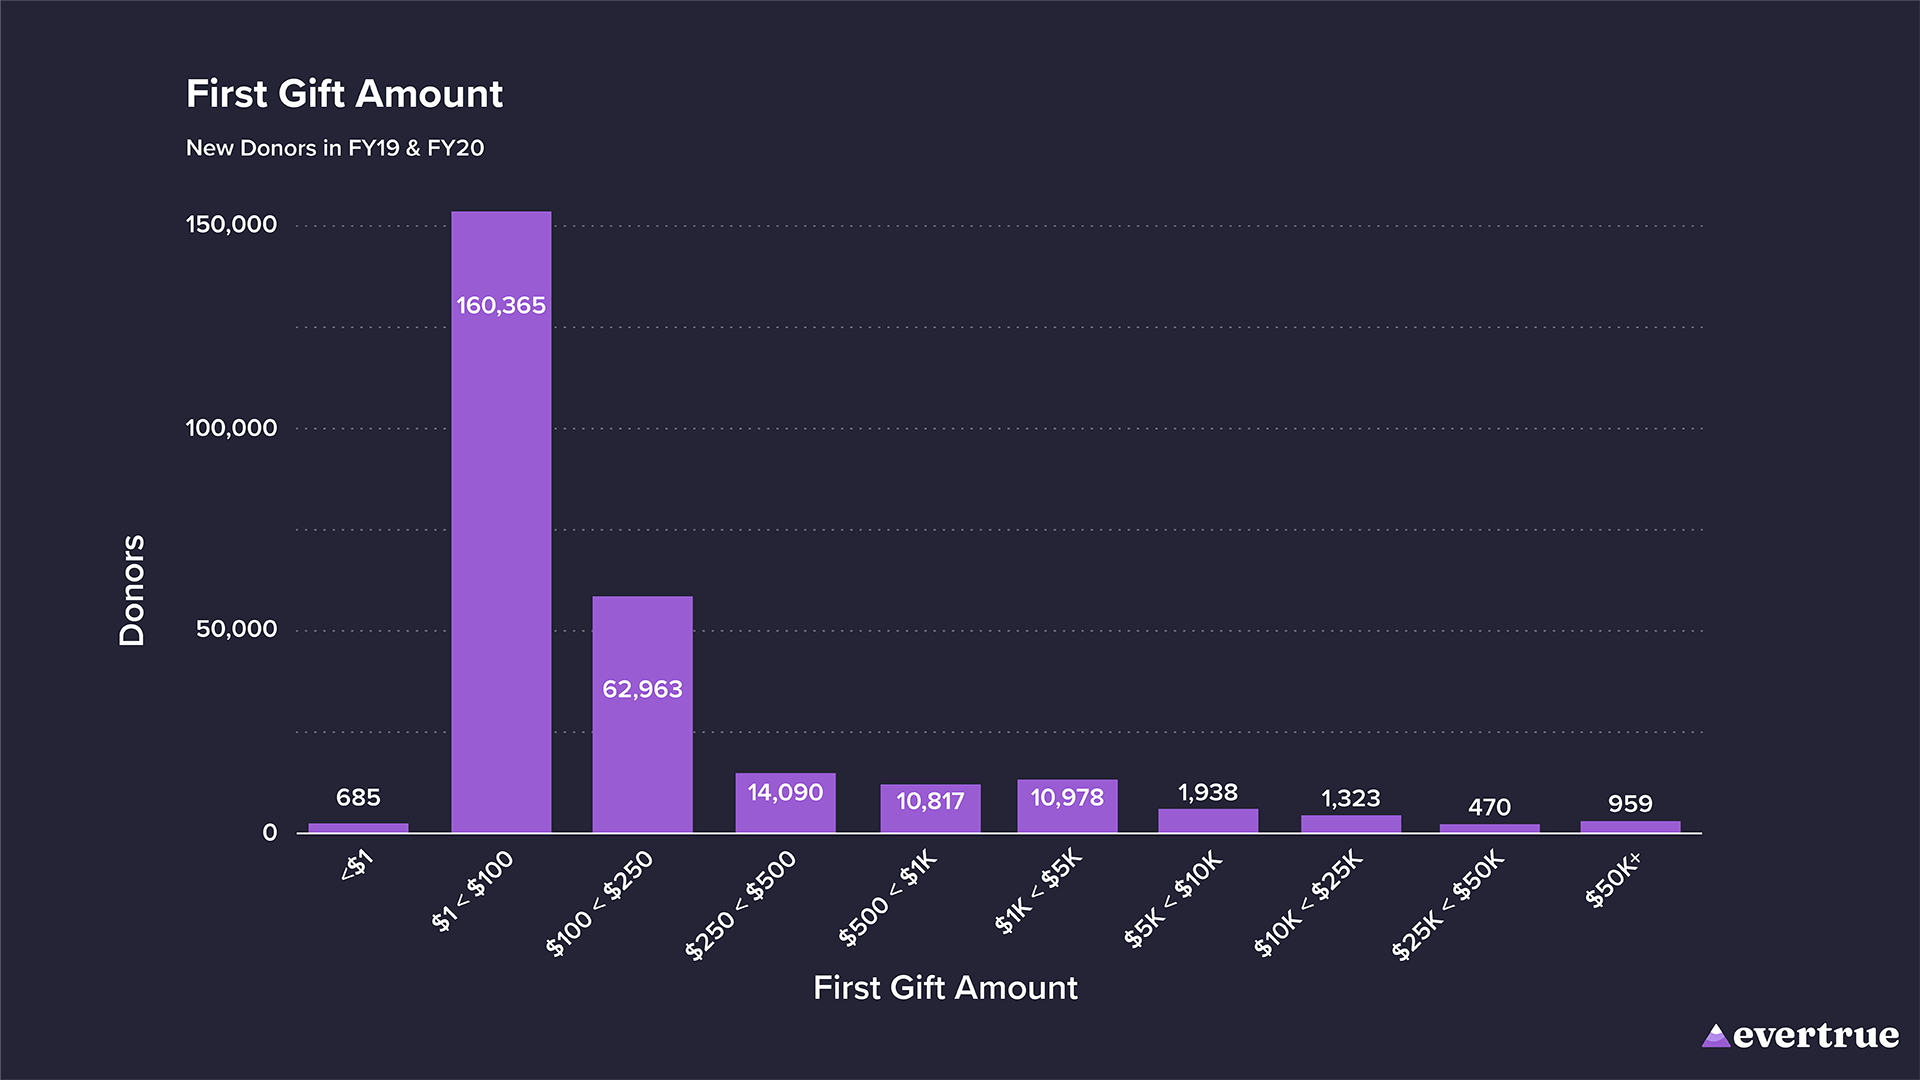
The following chart displays the number of donors within each first gift amount range.
*The distribution we see here follows the expected curve, with the majority of donors contributing smaller amounts. Specifically, the largest group of first-time donors, totaling 160,365 individuals, made contributions below $100. This trend is typical in fundraising, where initial gifts often serve as an entry point for deeper engagement, signaling the donor’s interest in the institution or a specific area of interest within the institution. The number of donors tapers off as gift amounts increase, with progressively fewer donors making larger contributions.
Key Takeaways
- Engage Non-Alumni Donors: Because non-alumni donors make up a substantial part of first-time donors, they present a valuable group to engage with. Create targeted outreach efforts aimed at this segment. Explore their motivations and interests to develop personalized engagement strategies that encourage their ongoing support and involvement.
- Follow Up With Small Gift Donors: Given how common gifts under $100 are, this group of donors is worth engaging beyond just that first gift, no matter how small. Continue to nurture these relationships to encourage more and potentially larger gifts down the road.
*These ranges include the lower amount but not the upper limit, which is indicated by the “less than” symbol. For instance, the range $100 < $250 includes gifts of exactly $100 but does not include any gifts of $250. First-Time donors with a gift amount of “$0” were removed from all analyses in this report. In addition, the chart shows a few gifts under $1, due to certain institutions’ practices of labeling undocumented estate gifts or other placeholder amounts with values below $1. Gifts of less than $1 will be removed from all future analyses in this report.
Understanding Donor Segmentation
The first gift amount often sets the stage for future fundraising activities, guiding how institutions segment and manage their donors in the months and years that follow the initial contribution.
In this section, we explore prospect segmentation, which groups first-time donors based on their initial gift size into three main categories. Knowing a new donor’s giving level helps inform engagement strategies. With the right strategies and tools in place, institutions can maximize limited resources and tap into the full potential of each segment.
Early Pipeline: Donors who made a first gift of $1 but less than $1,000.
Mid Pipeline: Donors who made a first gift of $1,000 but less than $10,000.
Late Pipeline: Donors who made a first gift of $10,000 or more.
The chart below illustrates the distribution of first-time donors across these segments.
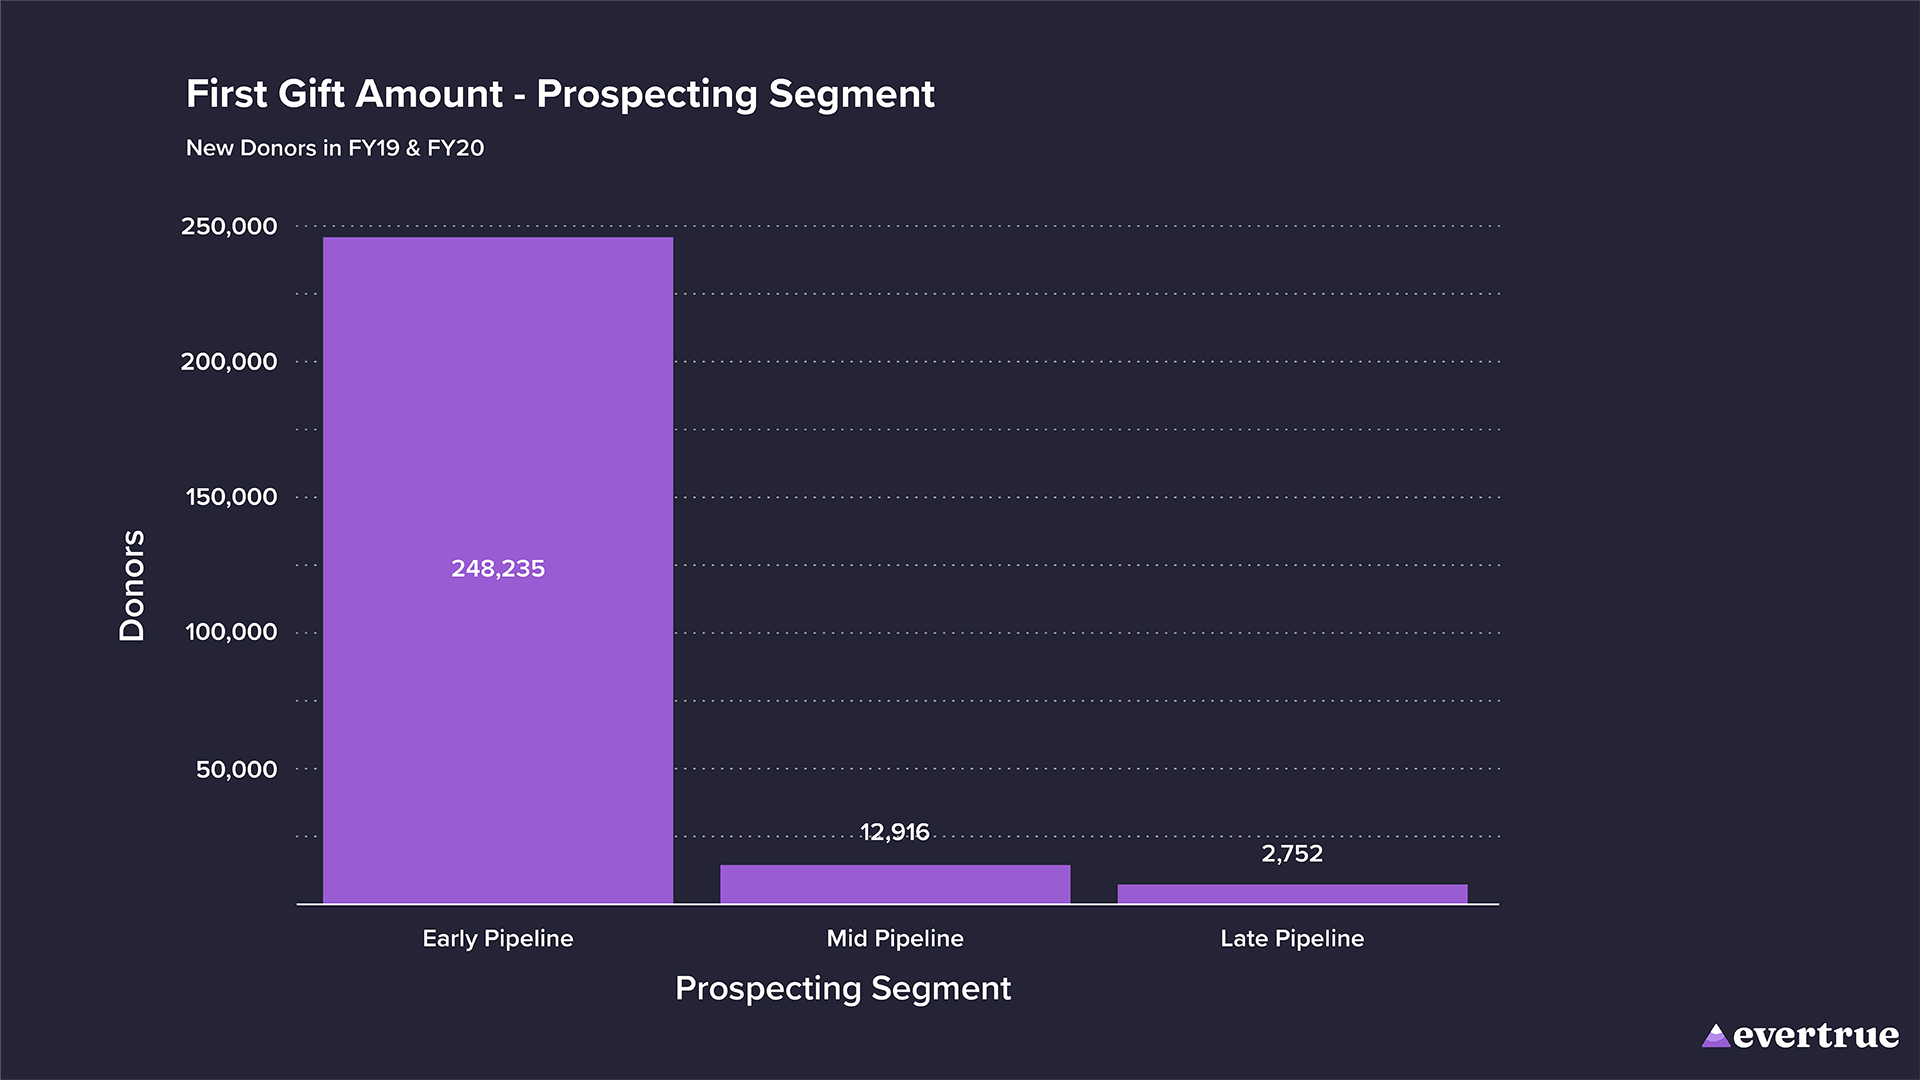
The vast majority of first-time donors fall into the Early Pipeline segment, with 248,235 donors contributing smaller initial gifts. As expected, Mid-Pipeline prospects and Late Pipeline prospects make up a much smaller portion of the first-time donor base. This distribution aligns with broader trends in philanthropy, where larger gifts are typically less frequent but hold significant importance for the institution.
“Friend” Constituents Continue to Dominate Donor Landscape

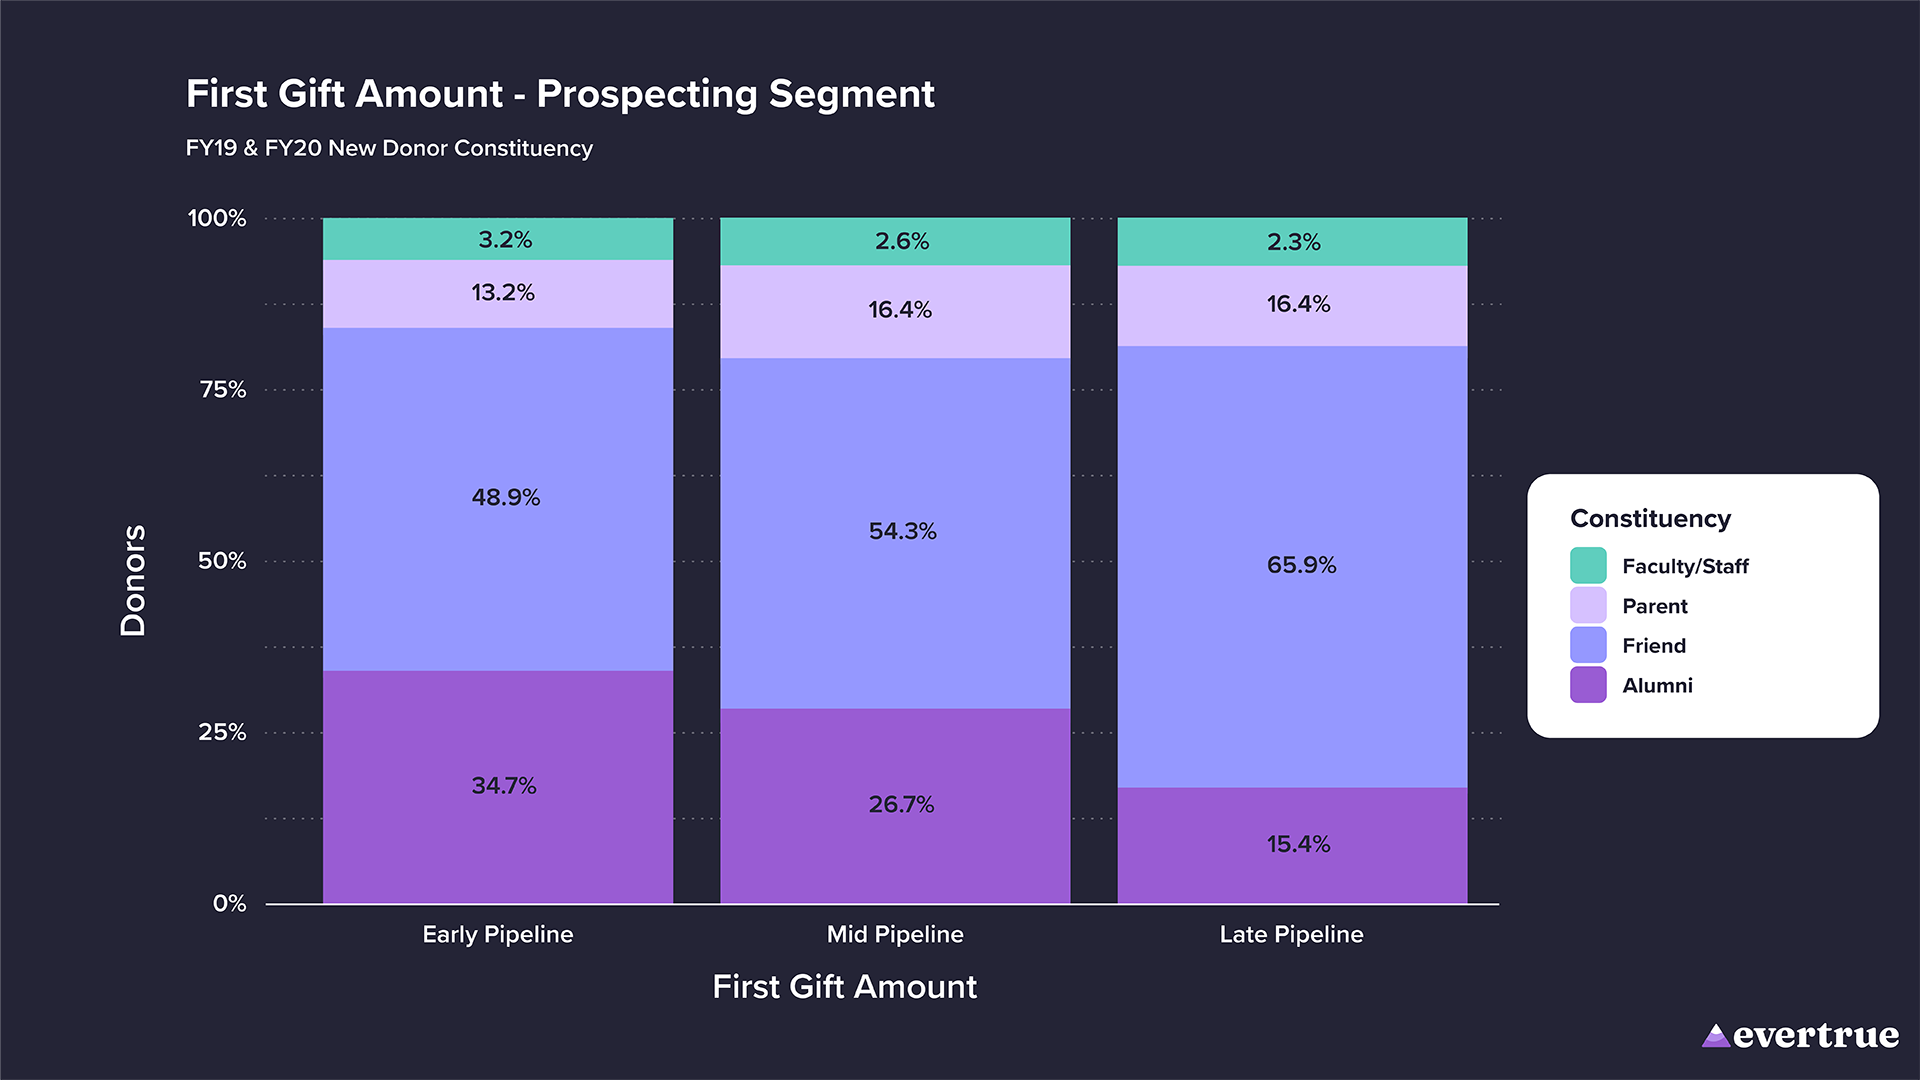
How to read these charts:
Throughout this report, you’ll find typical bar charts and percentage fill plots, like the one on the left above. Instead of showing raw counts or values, percentage fill plots focus on the composition of each group. They standardize the groups to a uniform size (100%), enabling you to examine the internal makeup of each group. This approach is particularly useful for smaller segments that might be less visible on a traditional bar chart. By expanding each group to 100%, you can uncover trends and insights that might otherwise go unnoticed.
As seen in all of the above perspectives, “Friends” constituents, those who do not fall into alumni, parent, or faculty/staff categories, continue to dominate the donor landscape, particularly as gift sizes increase. This trend aligns with earlier observations about non-alumni donors being more prevalent in larger gift categories. “Friends” make up a significant portion of the first-time donor pool across all gift sizes, suggesting that institutions should pay more attention to this group, which may not be traditionally targeted in alumni-focused fundraising strategies.
A particularly interesting trend is the relatively equal representation of parent donors across various gift sizes. Unlike alumni, whose representation decreases as gift sizes increase, parents appear consistently across all gift sizes, with a slight underrepresentation in the smallest gift category. This supports the idea that parents tend to give larger first-time gifts compared to other groups. Institutions might consider this when developing engagement strategies for parents, as they appear to have a higher giving potential from the outset.
Alumni, traditionally seen as a primary donor base, are less represented in the larger gift categories. This pattern, observed in the following alumni vs. non-alumni analysis, suggests that non-alumni, including friends and parents, are key contributors to higher-value gifts. Faculty and staff, while the smallest group, also exhibit consistent giving across gift sizes, albeit at lower levels.
Constituency and First Gift Size
Understanding how a donor’s connection to the organization affects their first gift amount helps add context to donor behavior and the varying potential across different groups. The charts below help illustrate these relationships, particularly the differences between alumni and non-alumni donors.
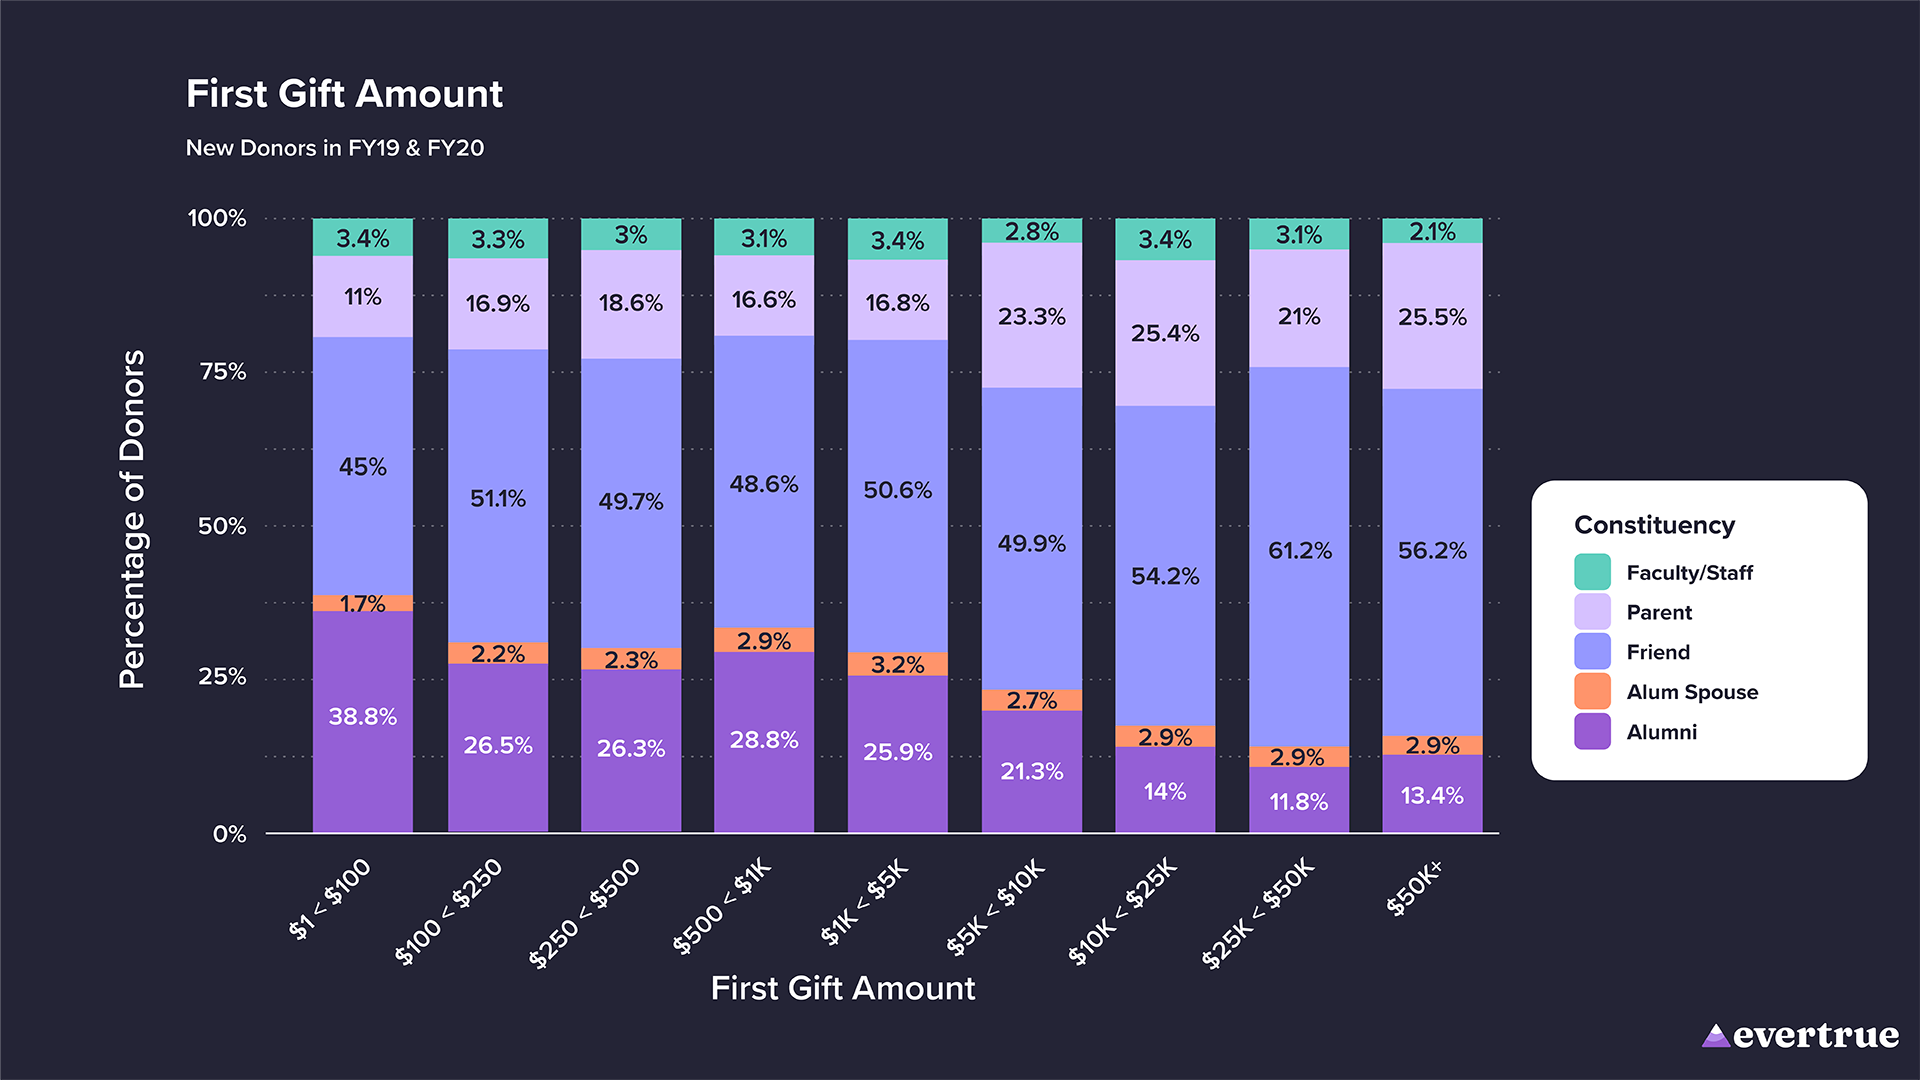
The charts below detail the distribution of first gifts by constituency type.
The first chart shows the absolute number of donors within each first gift amount bucket, segmented by constituency type. The second chart provides a 100% stacked bar representation of that same population, indicating the proportion of each constituency within each gift size category.
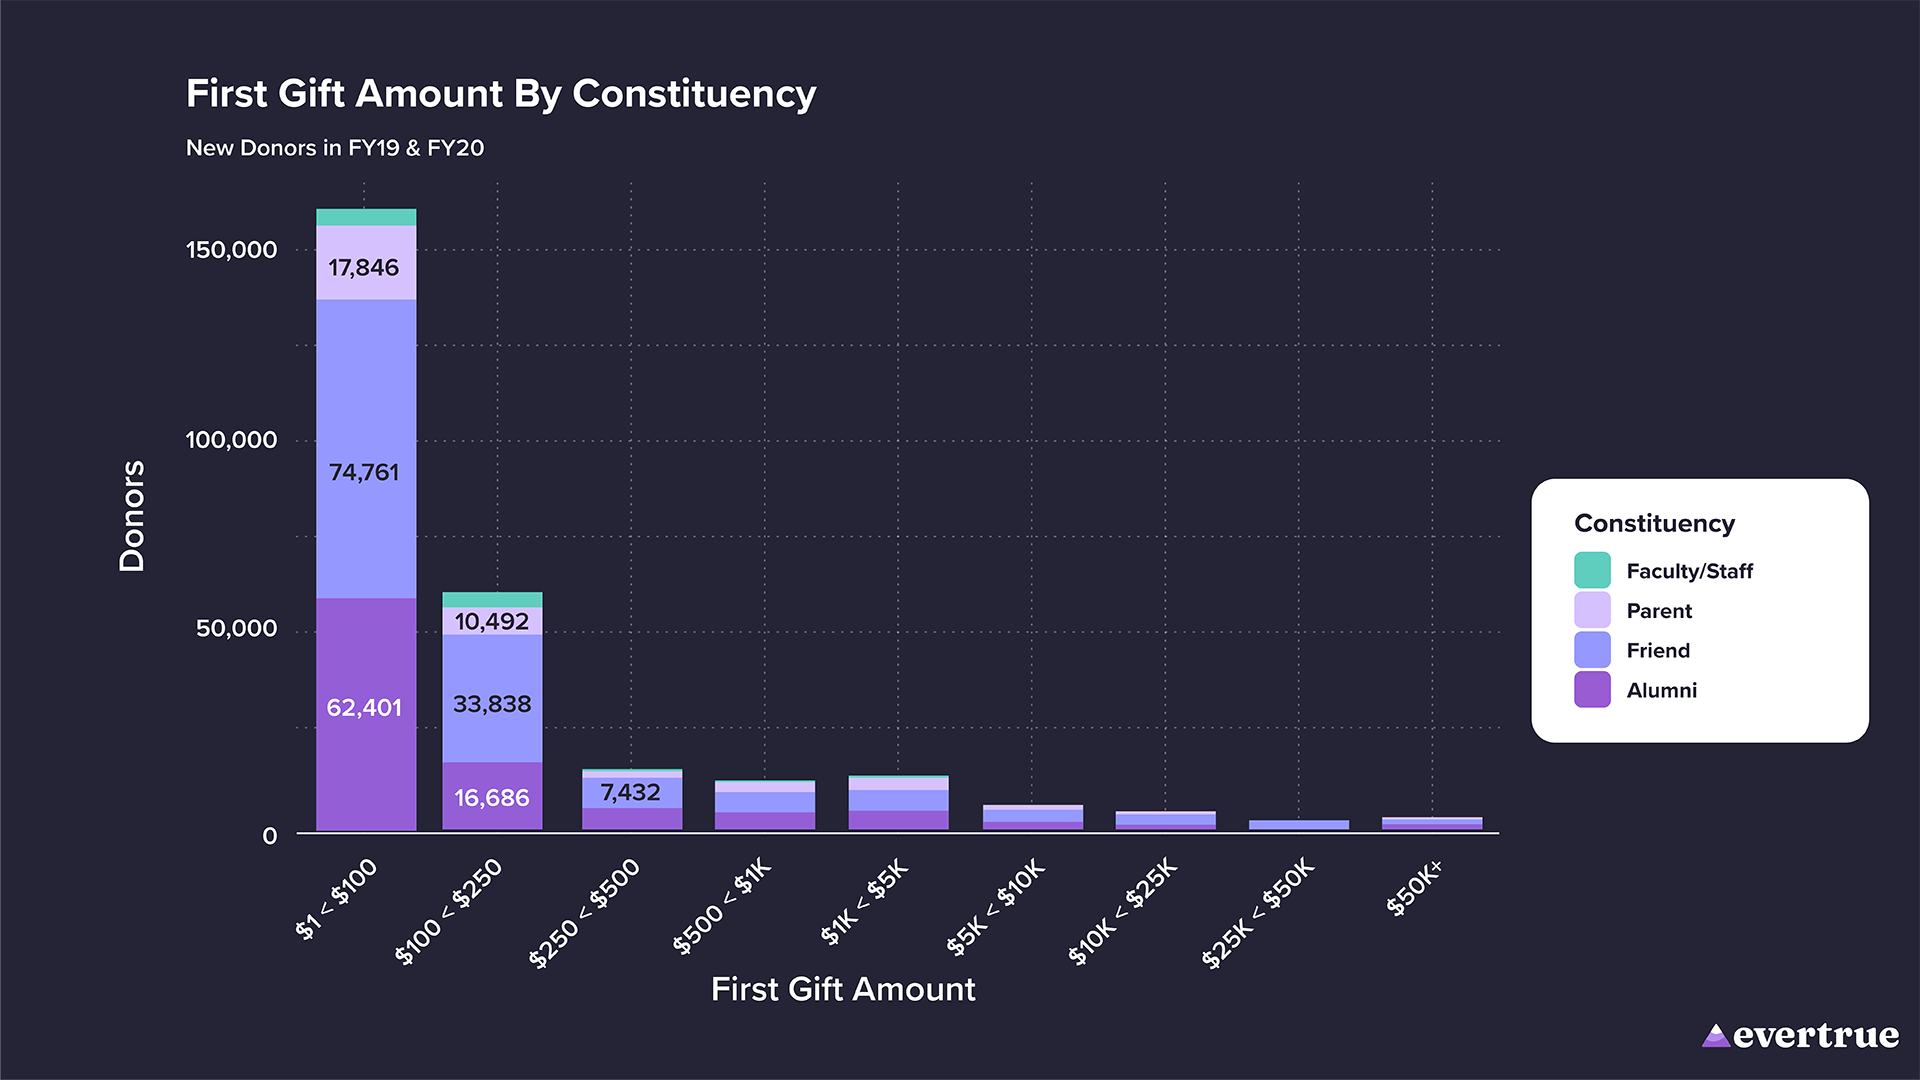
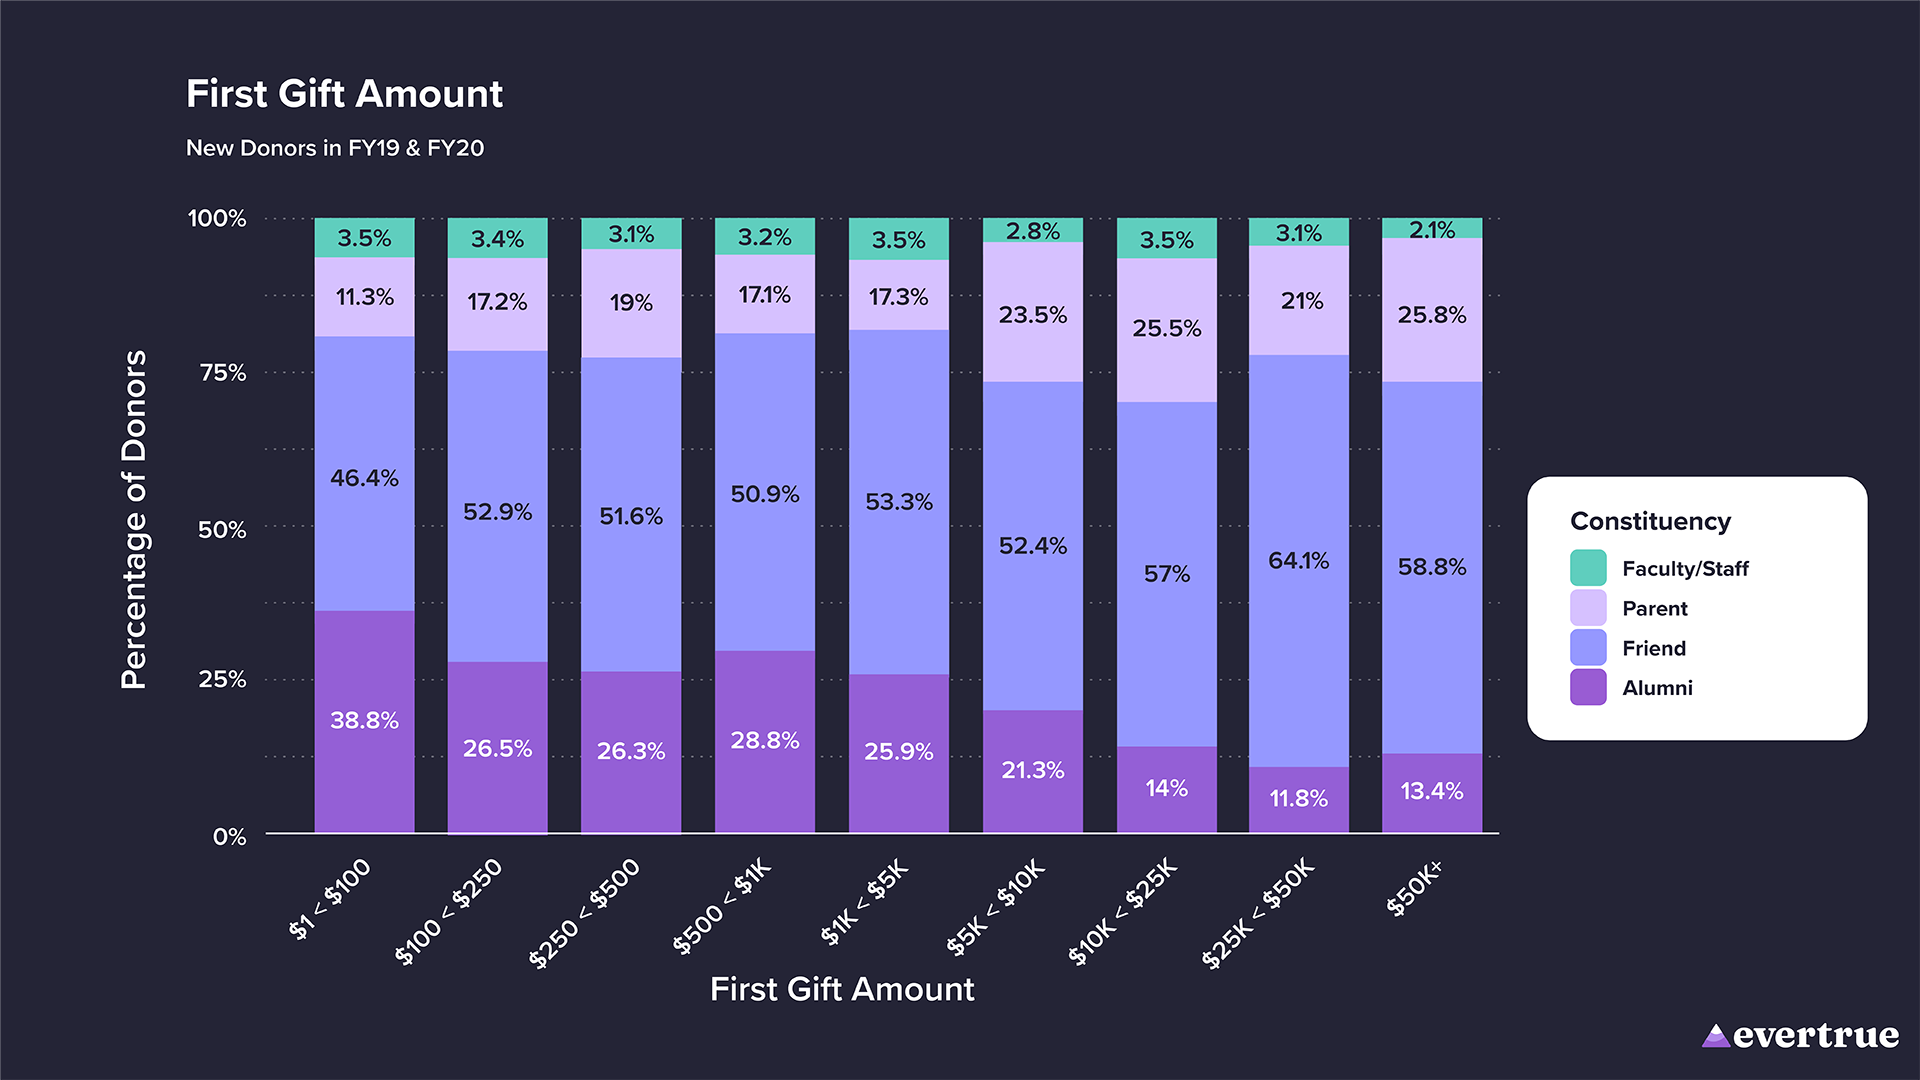
As noted in earlier sections of this report, “friend” prospects are more represented as gift size increases.
The Prominence of “Friends”
Several hypotheses could explain the prominence of friends in larger gift segments:
- Donors contributing larger gifts might be drawn to the institution through non-academic avenues, such as athletics or medical research. To explore this, a detailed assessment of gift designations of first-time gifts would be necessary.
- Another reason could be the rules that schools use for categorizing donors. For example, some schools might change a donor’s status from “Parent” to “Friend” once their child graduates since they’re no longer considered a parent donor. To really understand these changes, we’d need to look closely at how each school manages their donor data.
It should be noted that the theory that spouses of alumni could possibly have been documented as a “friend” was disproved. It appears that only a negligible proportion of “Friend” donors are connected to an alum via household relationships.
We intend to investigate these theories to the best of our ability in future research, with a goal of understanding more about how non-alumi first-time donors behave and what motivated them to give. We’ll provide updates as additional findings become available.
Key takeaways:
Prioritize Engagement with Non-Alumni Donors
With ‘Friends’ and parents dominating the larger gift categories, it’s time to shift gears and focus fundraising efforts on these groups. Build targeted strategies that highlight their giving potential and nurture their continued support. These audiences may present huge opportunities for larger contributions, sometimes even surpassing traditional alumni donors
You're almost halfway through—take a break! You've got about 13 minutes left
First-Time Donor Retention
The willingness of first-time donors to give again offers a lens into their ongoing relationship with the institution and the effectiveness of initial engagement strategies. So, understanding the timing and frequency of second gifts is an important element when assessing donor retention, long-term engagement and general pipeline health.
The following charts present the distribution of first-time donor retention by renewal timeframe. The renewal timeline was measured consistently across each donor, beginning with the day after their first gift (day 1) and extending through the next three years (day 1,096).
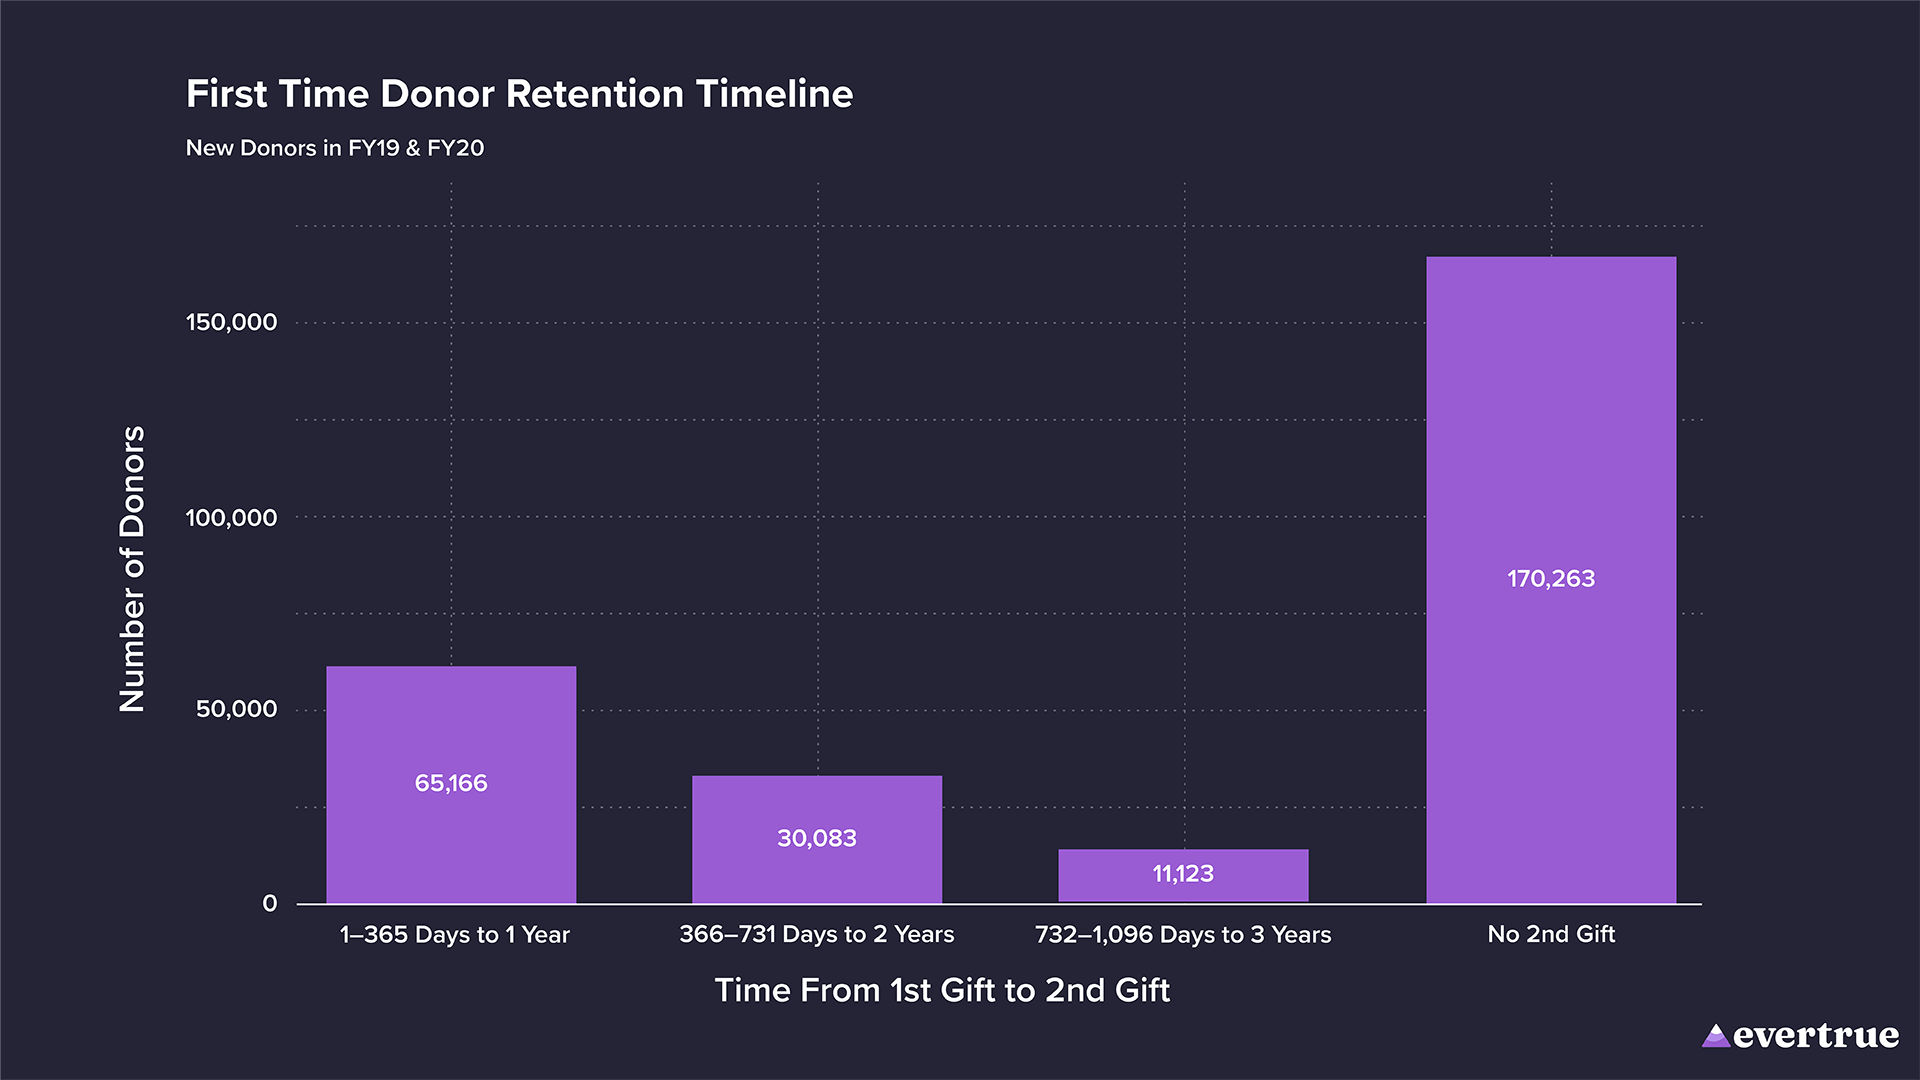
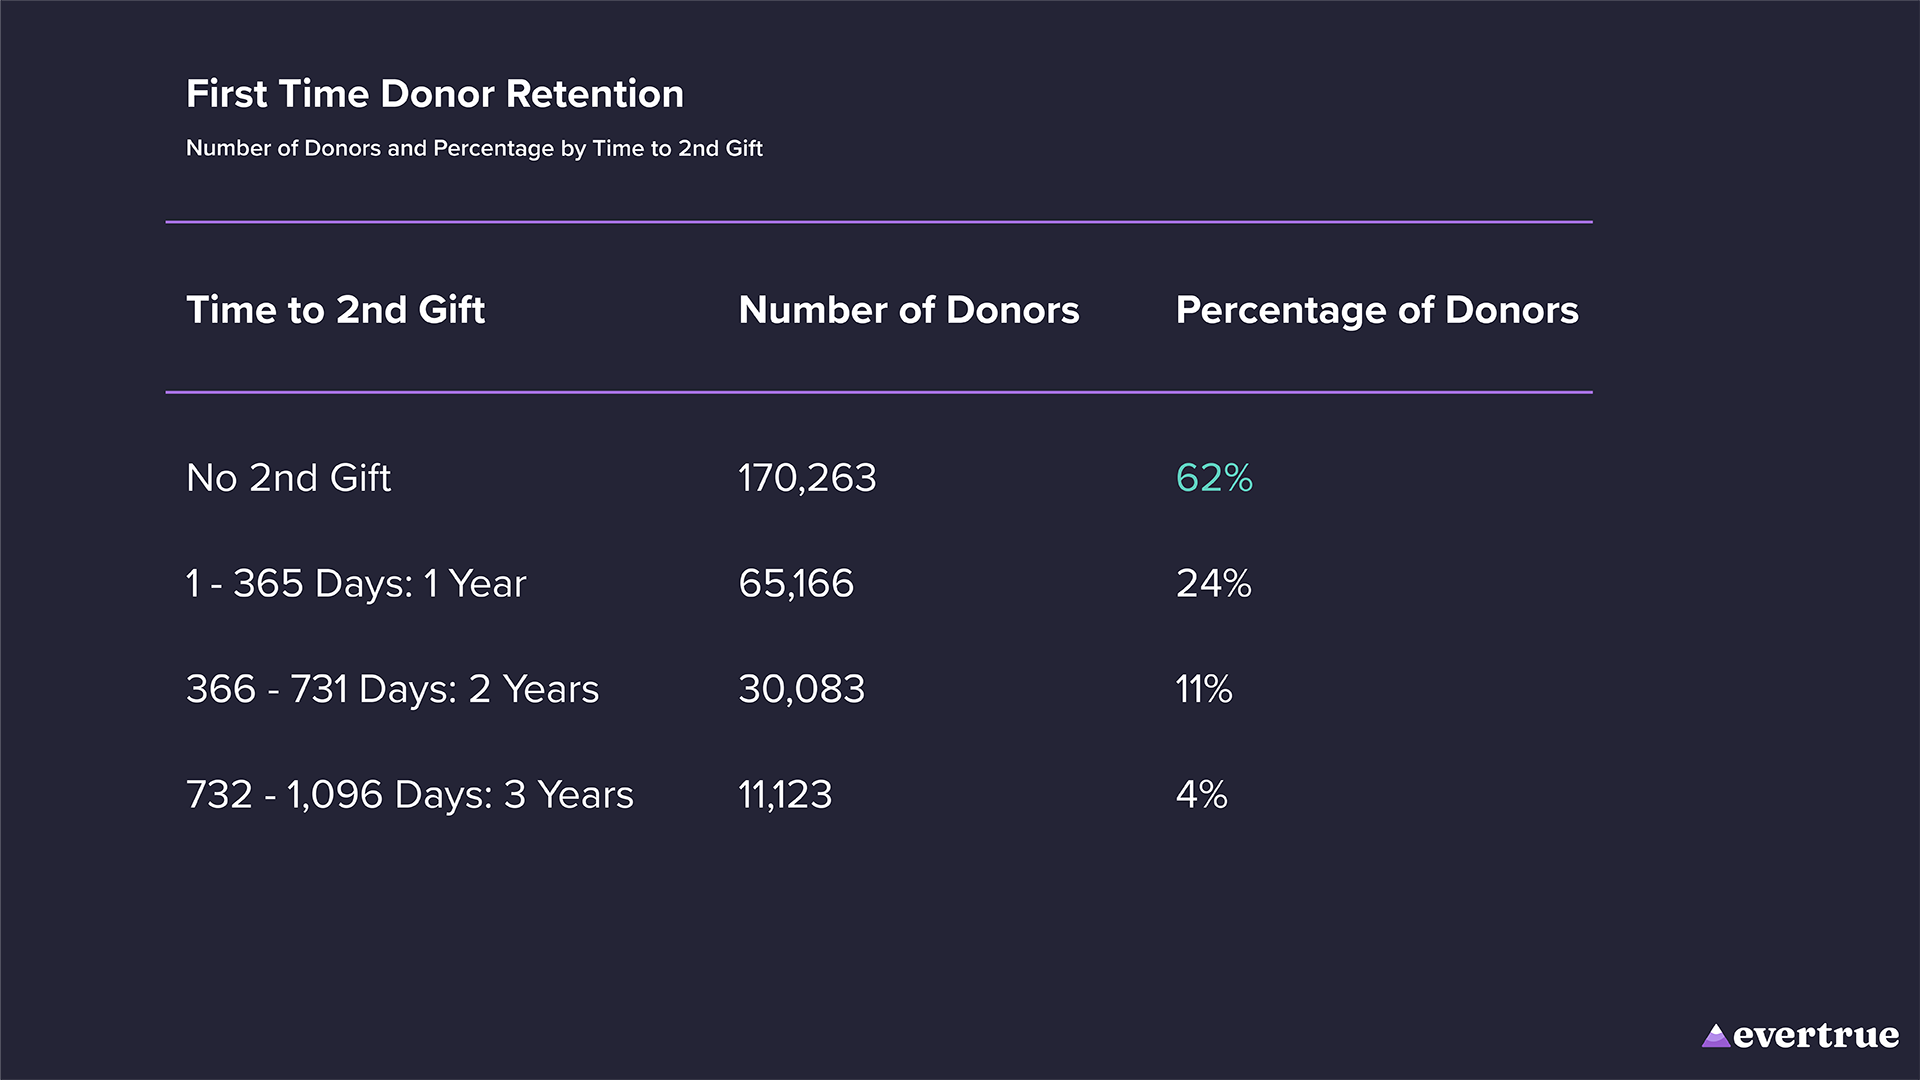
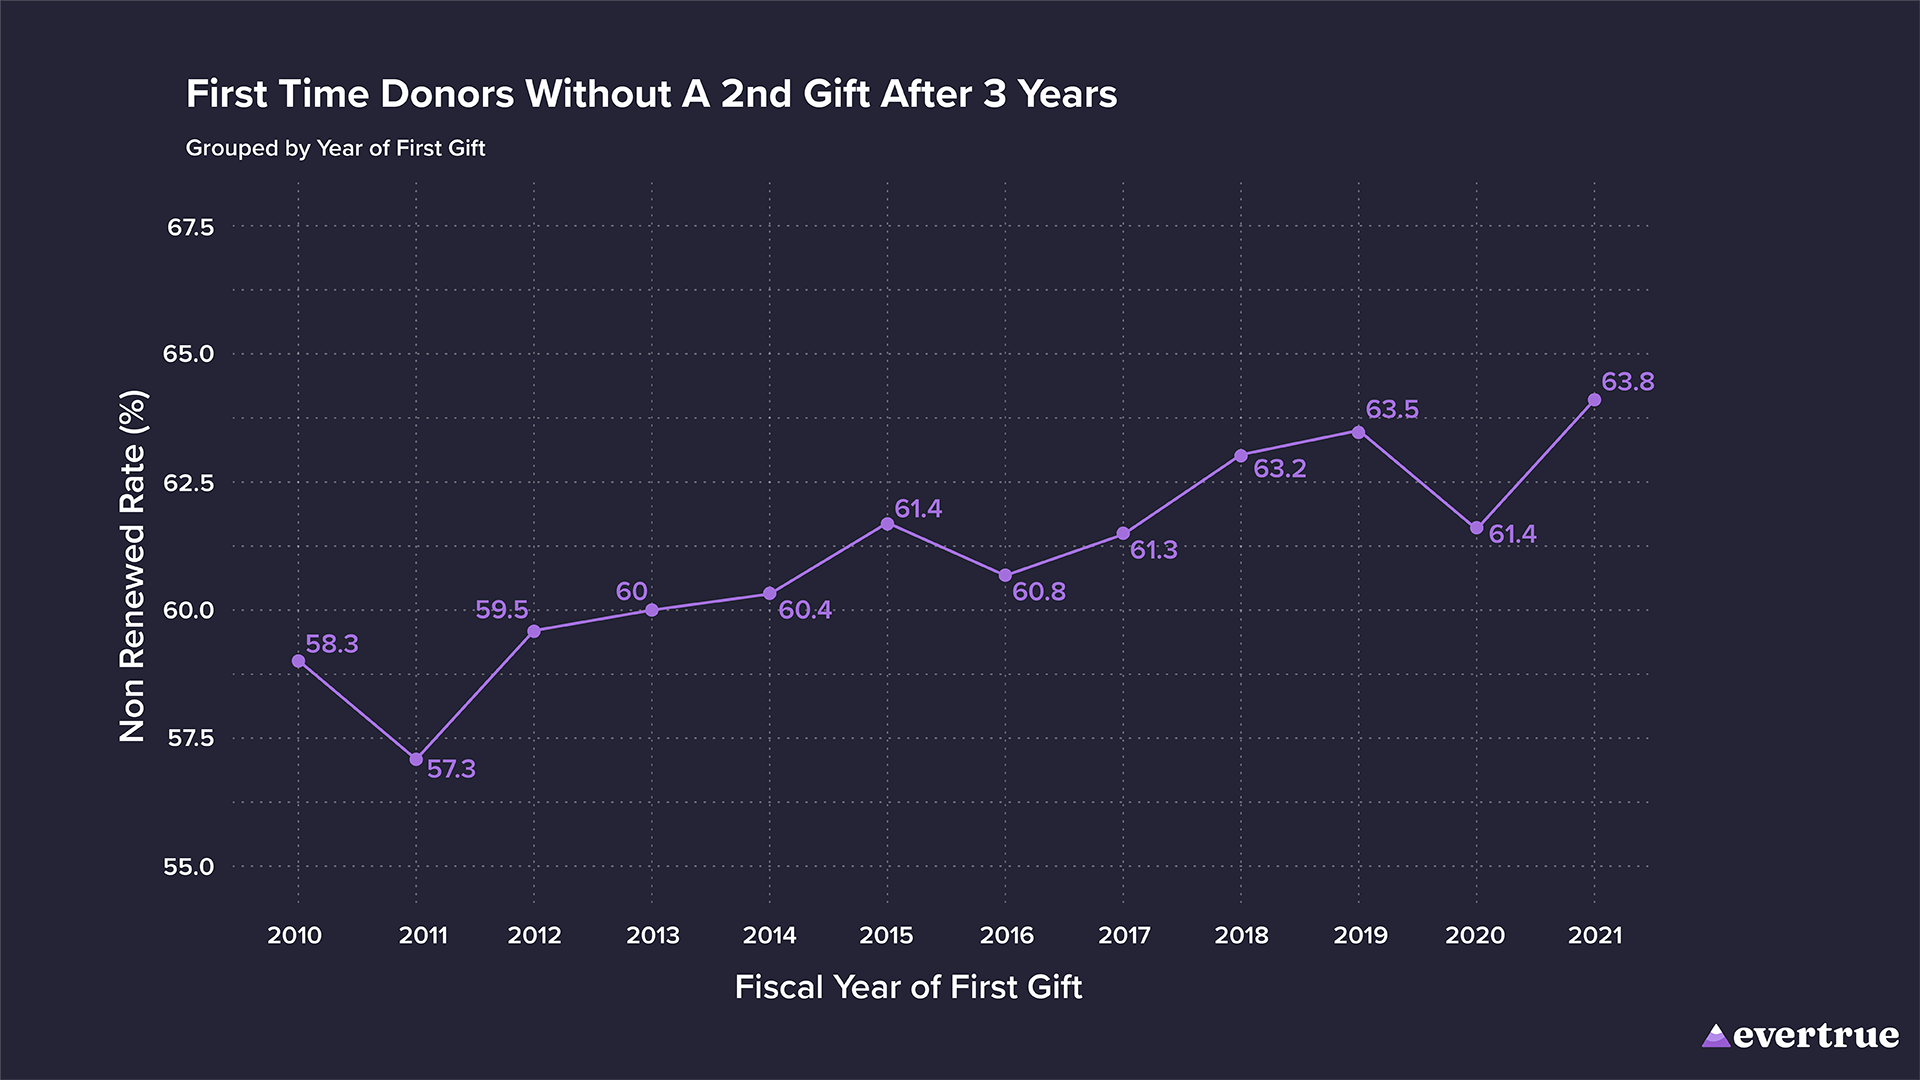
The most striking finding is that 62% of first-time donors did not make a second gift at any point within the three-year period after their inaugural contribution. This high attrition rate underscores the challenge of retaining first-time donors, especially in the short term.
For the 38% of donors who did renew, the majority made their second gift within the first year. Specifically, 24% of all first-time donors renewed within the first 365 days.
As time progresses, the likelihood of renewal decreases significantly. First-time donors who go an entire year without giving again have just an 11% chance of making a second gift the next year. If they lapse for two years, that chance drops to only 4%. The sharp decline in renewal rates after the first year indicates that if donors do not renew quickly, their connection to the institution may weaken, making it increasingly difficult to re-engage them.
While the overall population showed a 24% renewal rate within the first year, there is considerable variance among the institutions in the sample. The chart below highlights this variance, showing that some institutions experienced one-year retention rates as low as 11%, while others achieved rates as high as 38%.
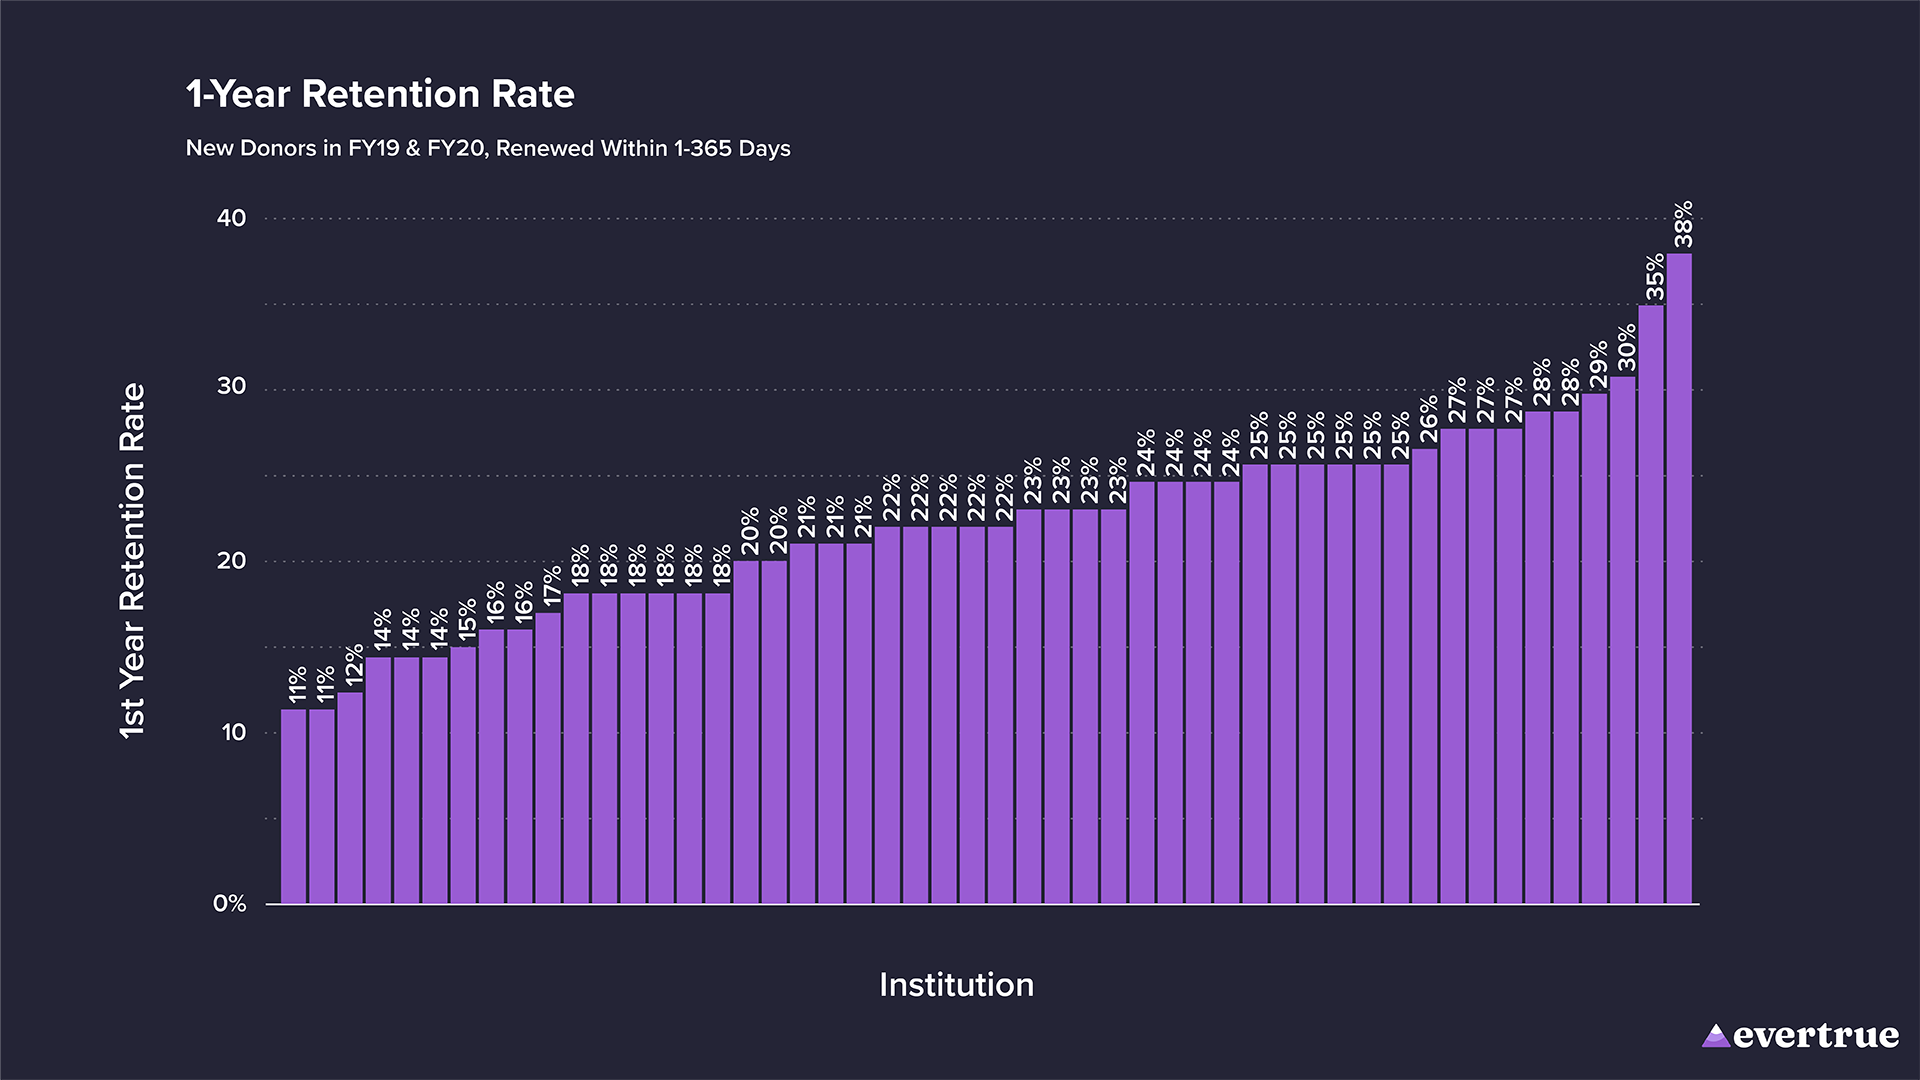
This range suggests that there are strategies and practices that certain institutions are successfully implementing to increase first-year retention and manage immediate donor churn. Institutions with higher retention rates likely have more effective engagement strategies, timely follow-ups, and personalized communication efforts that resonate with their donor base. Those with lower retention rates may benefit from evaluating and adjusting their donor stewardship practices to better nurture first-time donors.

The data underscores the importance of not only focusing on overall retention metrics but also understanding the practices that drive success in donor renewal. By analyzing and adopting the strategies of higher-performing institutions, others can potentially improve their own retention rates and build stronger, longer-lasting relationships with their donors.
Retention Patterns of First-Time Donors Over Three Years
Analyzing the retention patterns of first-time donors over three years provides valuable insights into the challenges and opportunities within donor engagement strategies. The attached plots offer a visual representation of renewal rates for different constituency groups, allowing us to better understand how these groups behave over time.
The first plot provides an overview of the renewal rates across all first-time donors, regardless of their constituency type.
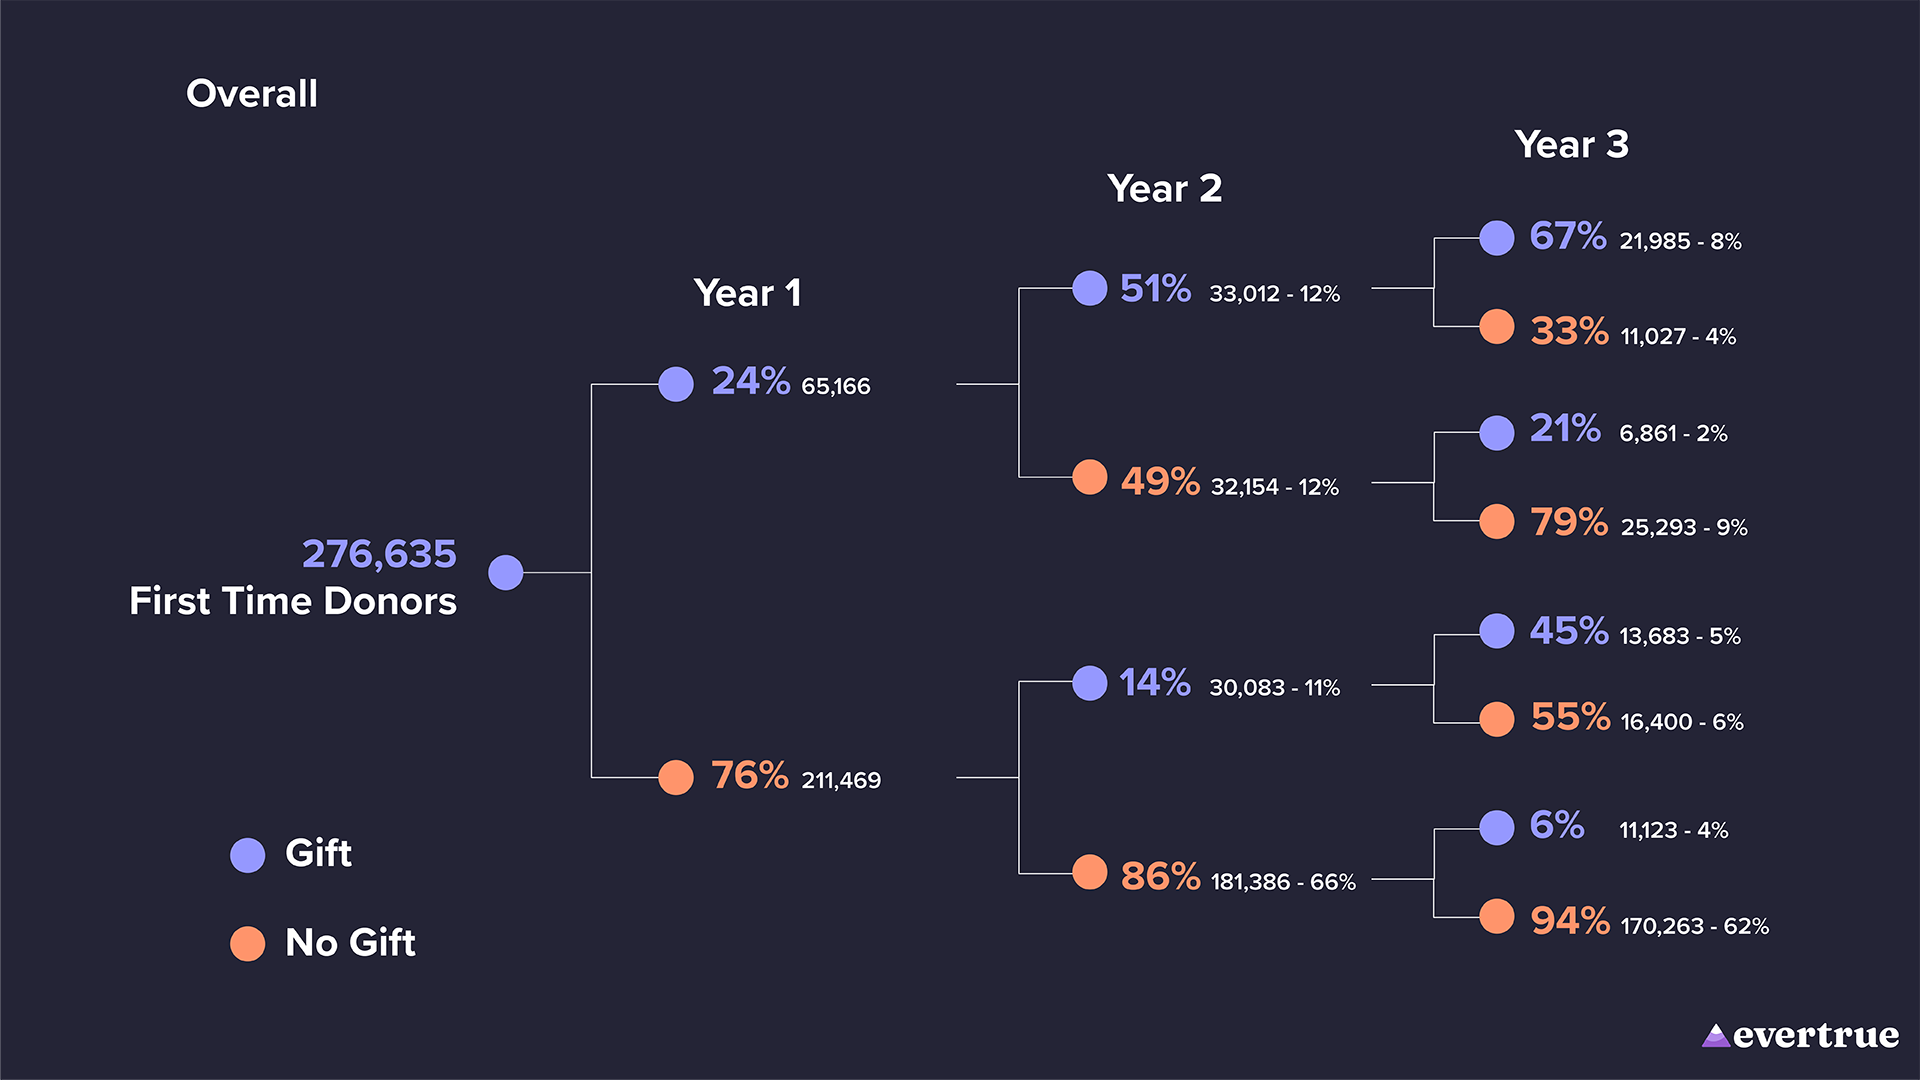
Looking at the entire pool of 276,635 first-time donors, which includes first-time donors who received donor credit with a gift transaction of $0, we see a stark decline in retention from Year 1 to Year 3.
Only 24% of first-time donors make a second gift in Year 1, and retention rates continue to decline with each subsequent year. By the end of the third year, only 4% of first-time donors who did not renew within the first two years are still engaged in giving.
While the majority of first-time donors do not return after their initial gift, the retention rates for those who remain engaged increase, particularly in the second and third years, indicating the importance of nurturing these relationships early on. This stark decline emphasizes the importance of effective engagement strategies immediately following the first gift. The first year is a pivotal period for donor retention, and any delays in follow-up could result in a permanent loss of donor interest.
When breaking down retention rates by constituency, two distinct patterns emerge: one for alumni and another for the “Friend” group, which includes donors with no formal ties to the institution as Alumni, Parents or Faculty/Staff members.
Alumni Donors
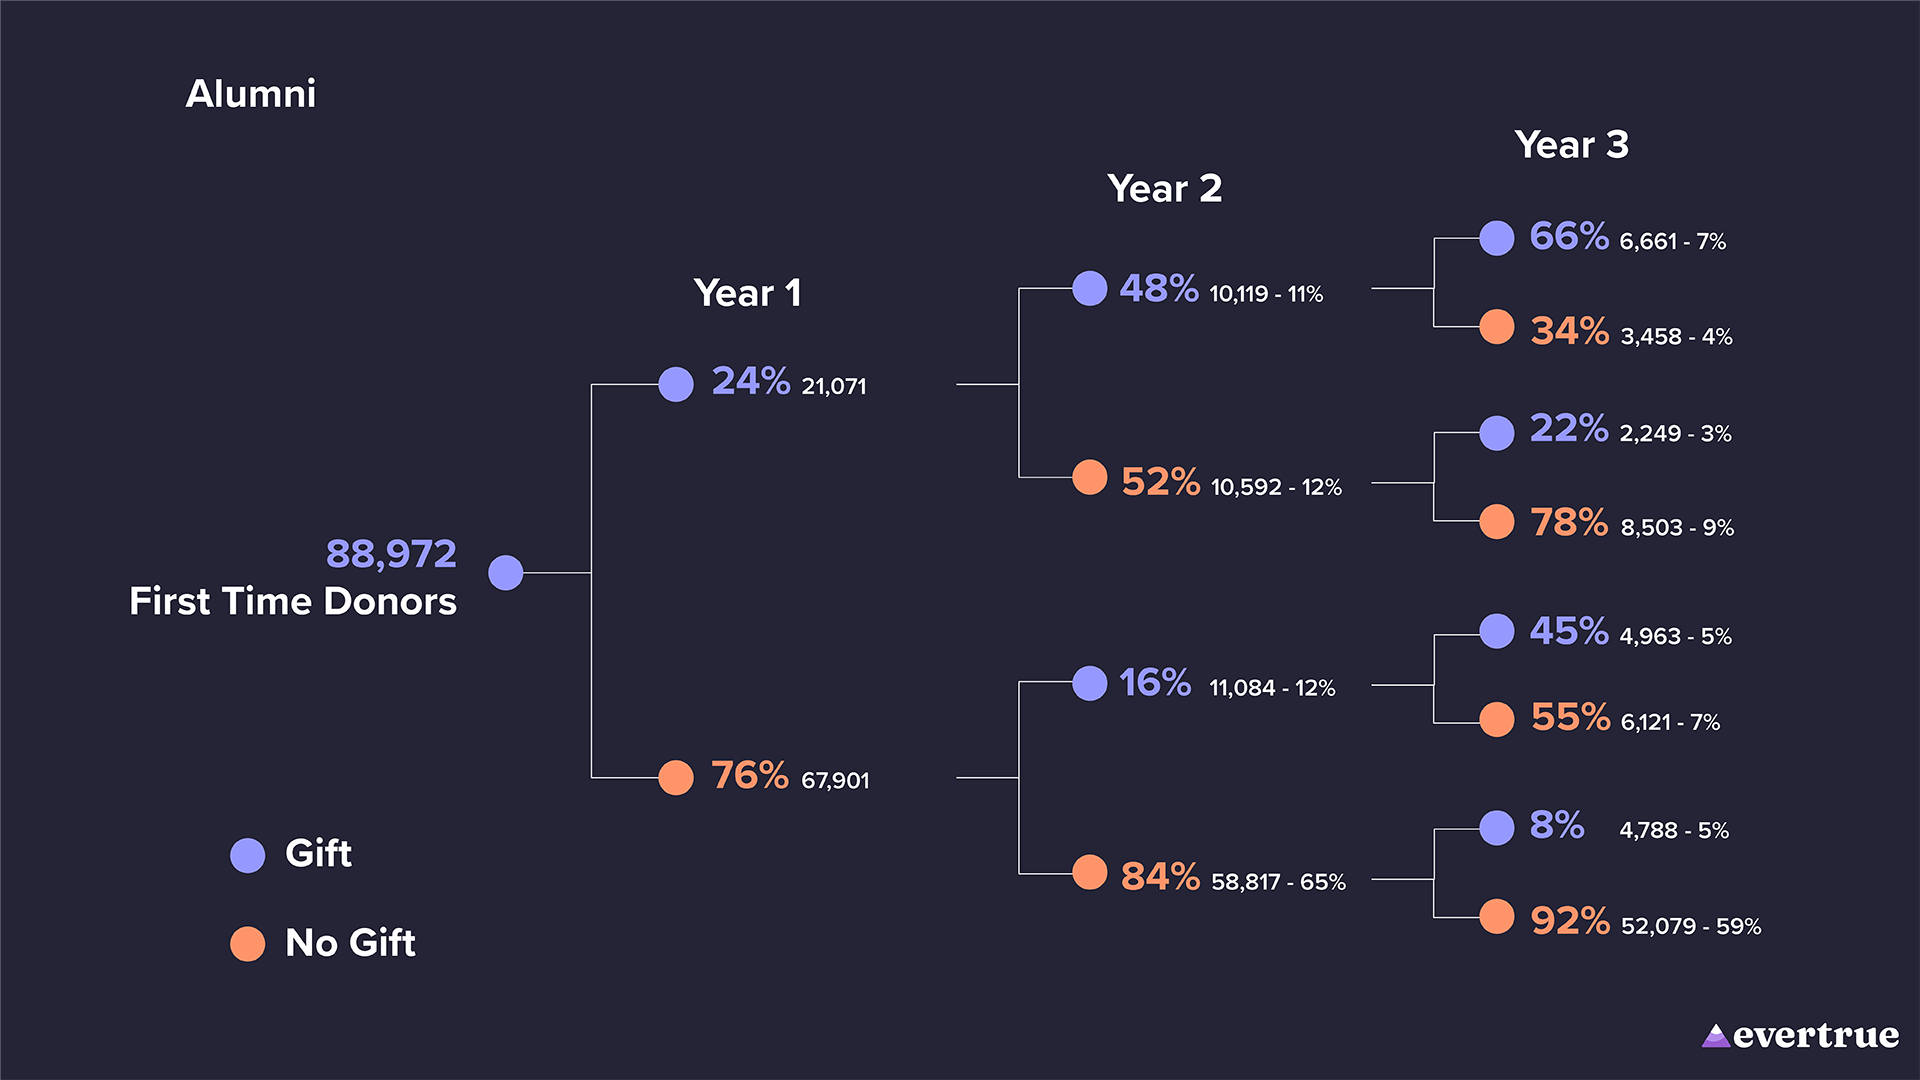
Alumni tend to have the same first-year retention rate (24%) as the overall average. By the third year, the retention rate among those who did not renew earlier is 8%.
This suggests that while alumni may be more inclined to stay engaged in the short term, long-term retention remains a challenge. Alumni-focused strategies should leverage their initial connection to the institution but must also innovate to sustain engagement beyond the first couple of years.
“Friend” Donors

The “Friend” group shows a lower first-year retention rate of 19%, indicating that these donors are less likely to renew quickly after their first gift. However, among those who do renew, there is a relatively higher likelihood of continued engagement into the second and third years compared to alumni.
This suggests that while friends are less likely to give a second time within a year, those who do can be cultivated into longer-term supporters. Institutions should explore ways to improve early-stage engagement with friends, perhaps by identifying potential affinity touchpoints outside the traditional alumni-based strategies.
The following two charts further illustrate these trends by showing both the volume and percentage of donors across constituencies who went without renewing over the three-year period following their first gift.
The plot on the left shows the raw number of donors within each constituency type and their retention status over three years, while the plot on the right offers a percentage-based view within each group.
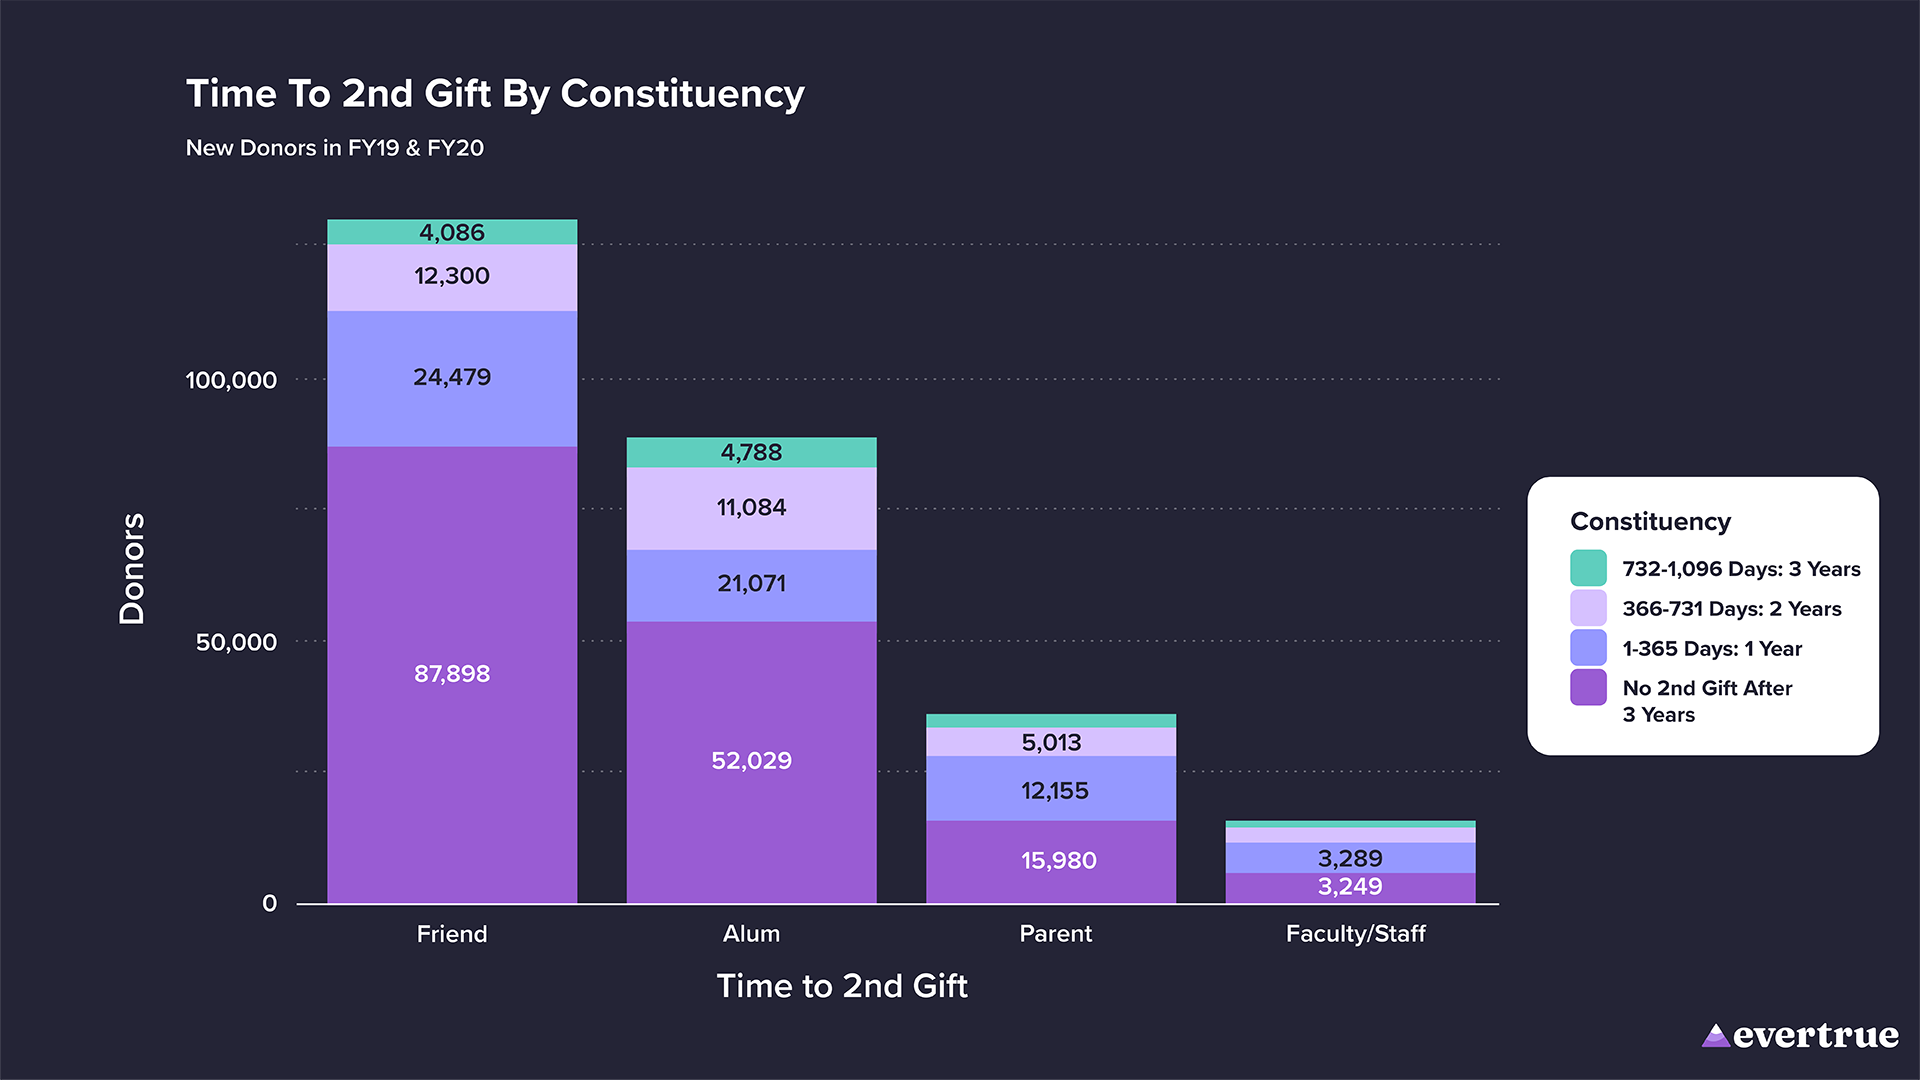
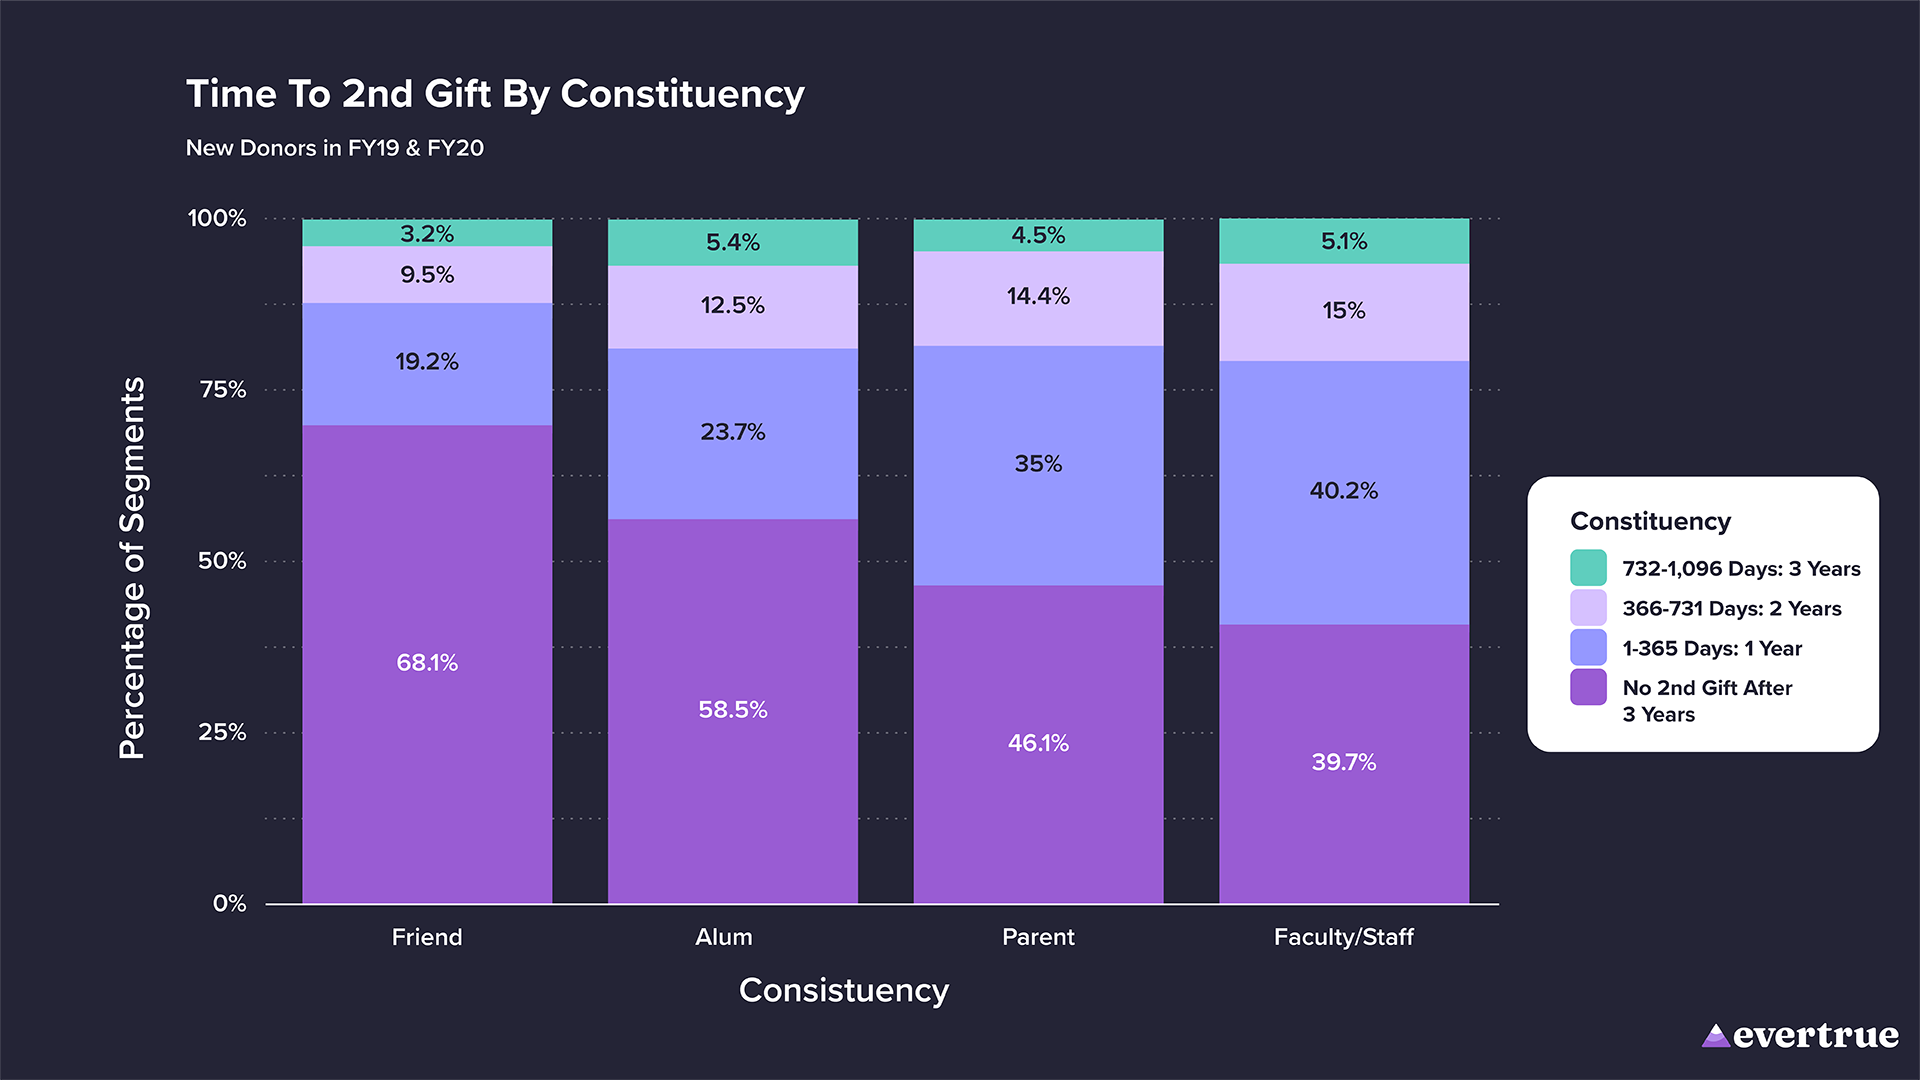
The “Friend” constituency, while having the largest initial donor volume, also exhibits the highest proportion of donors who do not make a second gift within 3 years. This reinforces the idea that while “Friends” represent a significant portion of first-time donors, they also present the greatest retention challenge.
The “Parent” and “Faculty/Staff” groups show a more balanced retention pattern, with fewer donors dropping off completely. Particularly, parents display a higher rate of renewal within the first year compared to friends, indicating that their connection to the institution, often through their children, may foster a stronger initial commitment.
This data highlights the potential value in cultivating relationships with non-alumni donors. While they may not renew as quickly as alumni, the ones who do are likely to stay engaged over a longer period. Institutions should consider developing tailored strategies that resonate with this group, possibly focusing on their unique motivations and interests in the institution.
Key Takeaways
These findings highlight the importance of customizing engagement strategies for different donor groups. Alumni often connect with initiatives that tap into their nostalgia and affinity for the institution, but keeping them engaged requires continued effort beyond the first year. On the flip side, ‘Friends’ of the institution might require more personalized outreach to prompt their initial renewal, but once they’re engaged, they have the potential for long-term commitment.
Retention data makes one thing clear: institutions need to prioritize early, consistent engagement across all donor groups to maximize long-term value. To boost overall retention rates, institutions should:
- Prioritize Early Engagement & Retention Efforts: Across all groups, retention rates drop significantly after the first year. Developing personalized follow-up strategies immediately after the first gift would help improve donor retention overall.
- Sustained Engagement Yields Strong Results: Although retention drops across all groups, the individuals who do stay engaged after Year 1 are more likely to continue supporting the institution in later years. This reinforces the importance of stewardship and long-term cultivation strategies.
- Leverage Technology: Utilize tools that help automate and personalize donor outreach, such as Signal by EverTrue, a platform that leverages the power of cadence-based workflows, ensuring that no potential renewal opportunity is overlooked.
For EverTrue customers, we are always available to discuss strategies for interpreting these insights and applying them to your unique donor base.
First Gift Follow-Up
As we shift the conversation toward relationship-building and fostering a positive donor experience as a means of increasing first-time donor retention, it’s important to consider the timing and nature of follow-up interactions after a donor’s first gift. In addition to analyzing gift transactions, this research also focused on gathering interaction data for all donors included in the study.
Specifically, we examined interactions that occurred after the first gift was made, with the minimum date for interactions set to the day following the first gift. The results of this data collection revealed that 114,723 donors, or 42%, received follow-up after their first gift. The remaining 58% of donors had no follow-up interactions logged, highlighting a significant gap in follow-up efforts.
The following chart categorizes the interactions by type, offering a standardized view across institutions. Interaction types were consolidated into broadly-accepted categories to ensure consistency in our analysis.
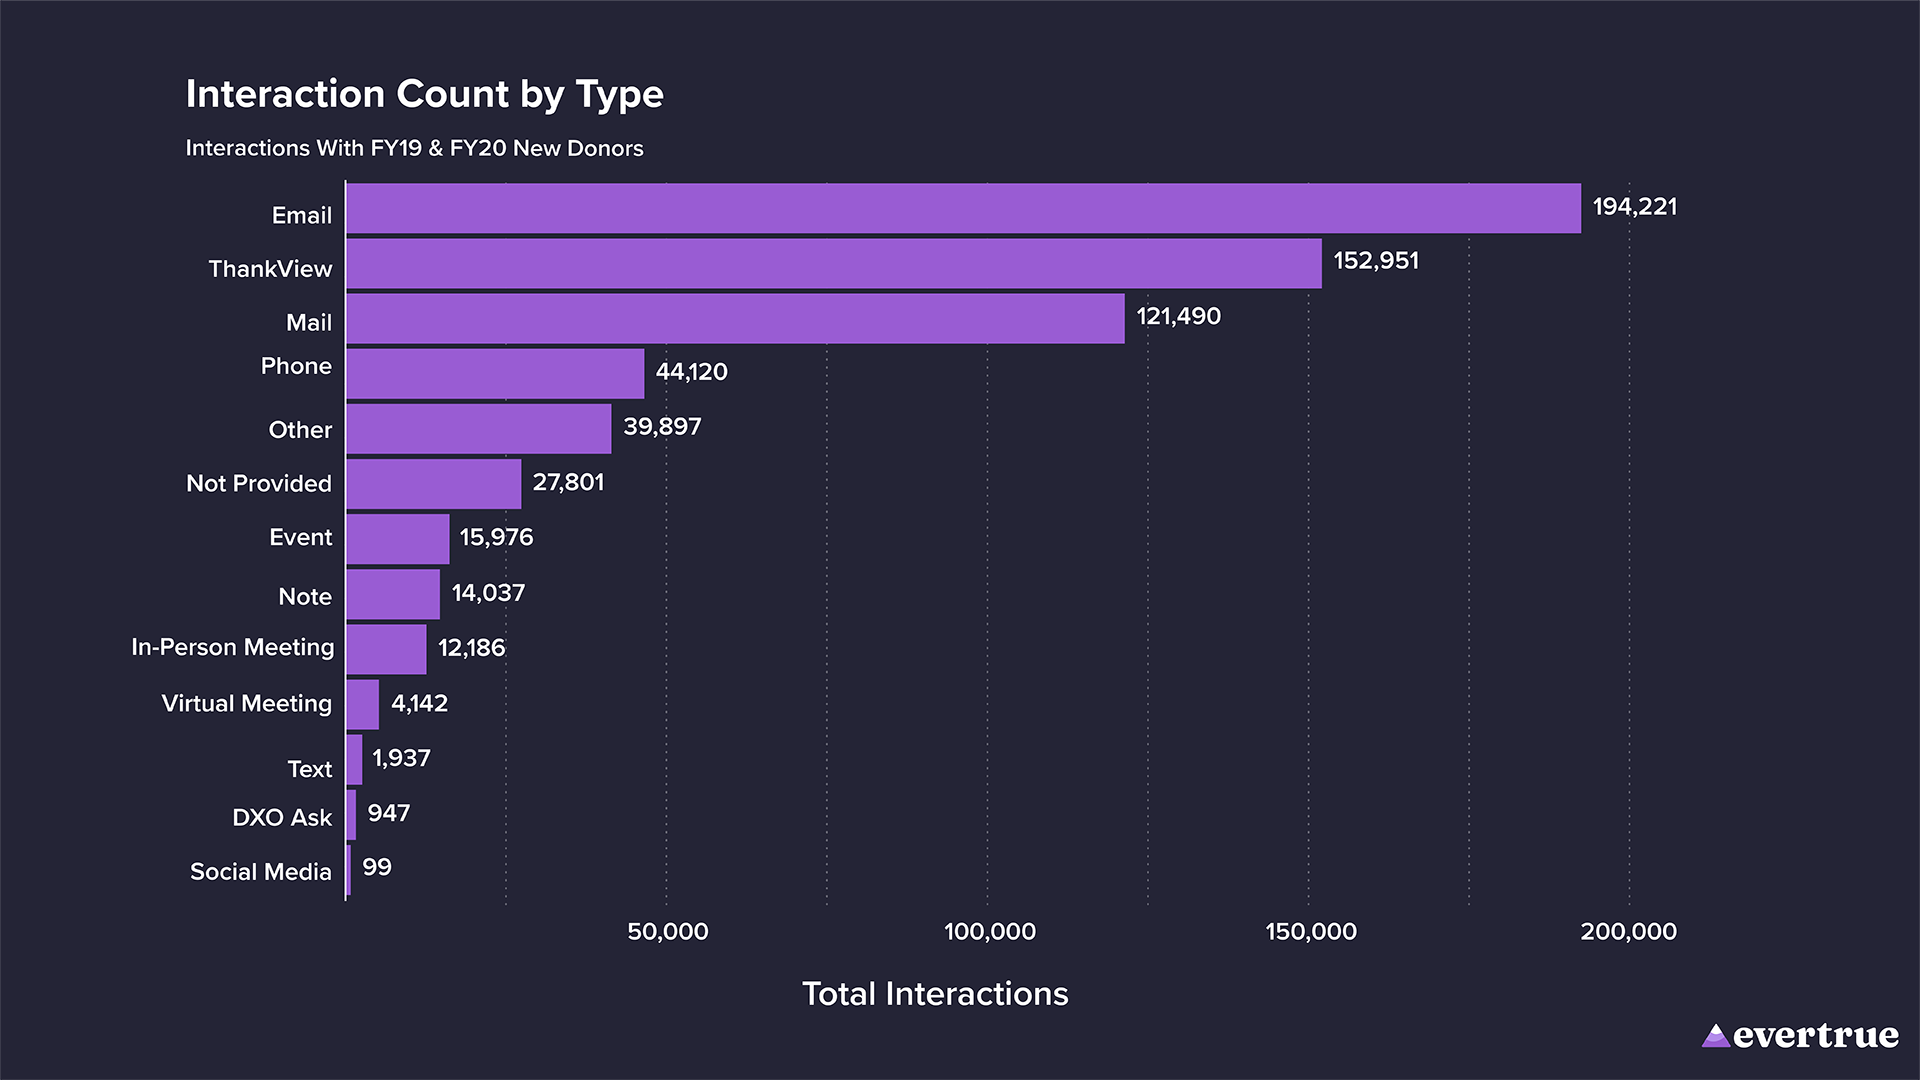
This detailed breakdown of interaction data provides a look into how institutions are engaging with first-time donors, and when. The diversity in interaction types and the varying levels of engagement across institutions suggest that there is no single approach to donor outreach. However, the data also highlights the significant portion of donors who did not receive any recorded follow-up, pointing to potential areas for improvement in donor retention strategies.
Response Time Between First Gift and First Interaction
The time it takes for an institution to follow up with a first-time donor can significantly influence the donor’s perception of the organization and their willingness to continue supporting it. This section examines the median number of days between a donor’s first gift and the first interaction logged in the CRM system, broken out by communication channels commonly used in higher education fundraising.
Before reviewing the data, it was assumed that channels like email and video messages that use automation and instant delivery would have the shortest response times. However, the data revealed an unexpected trend.
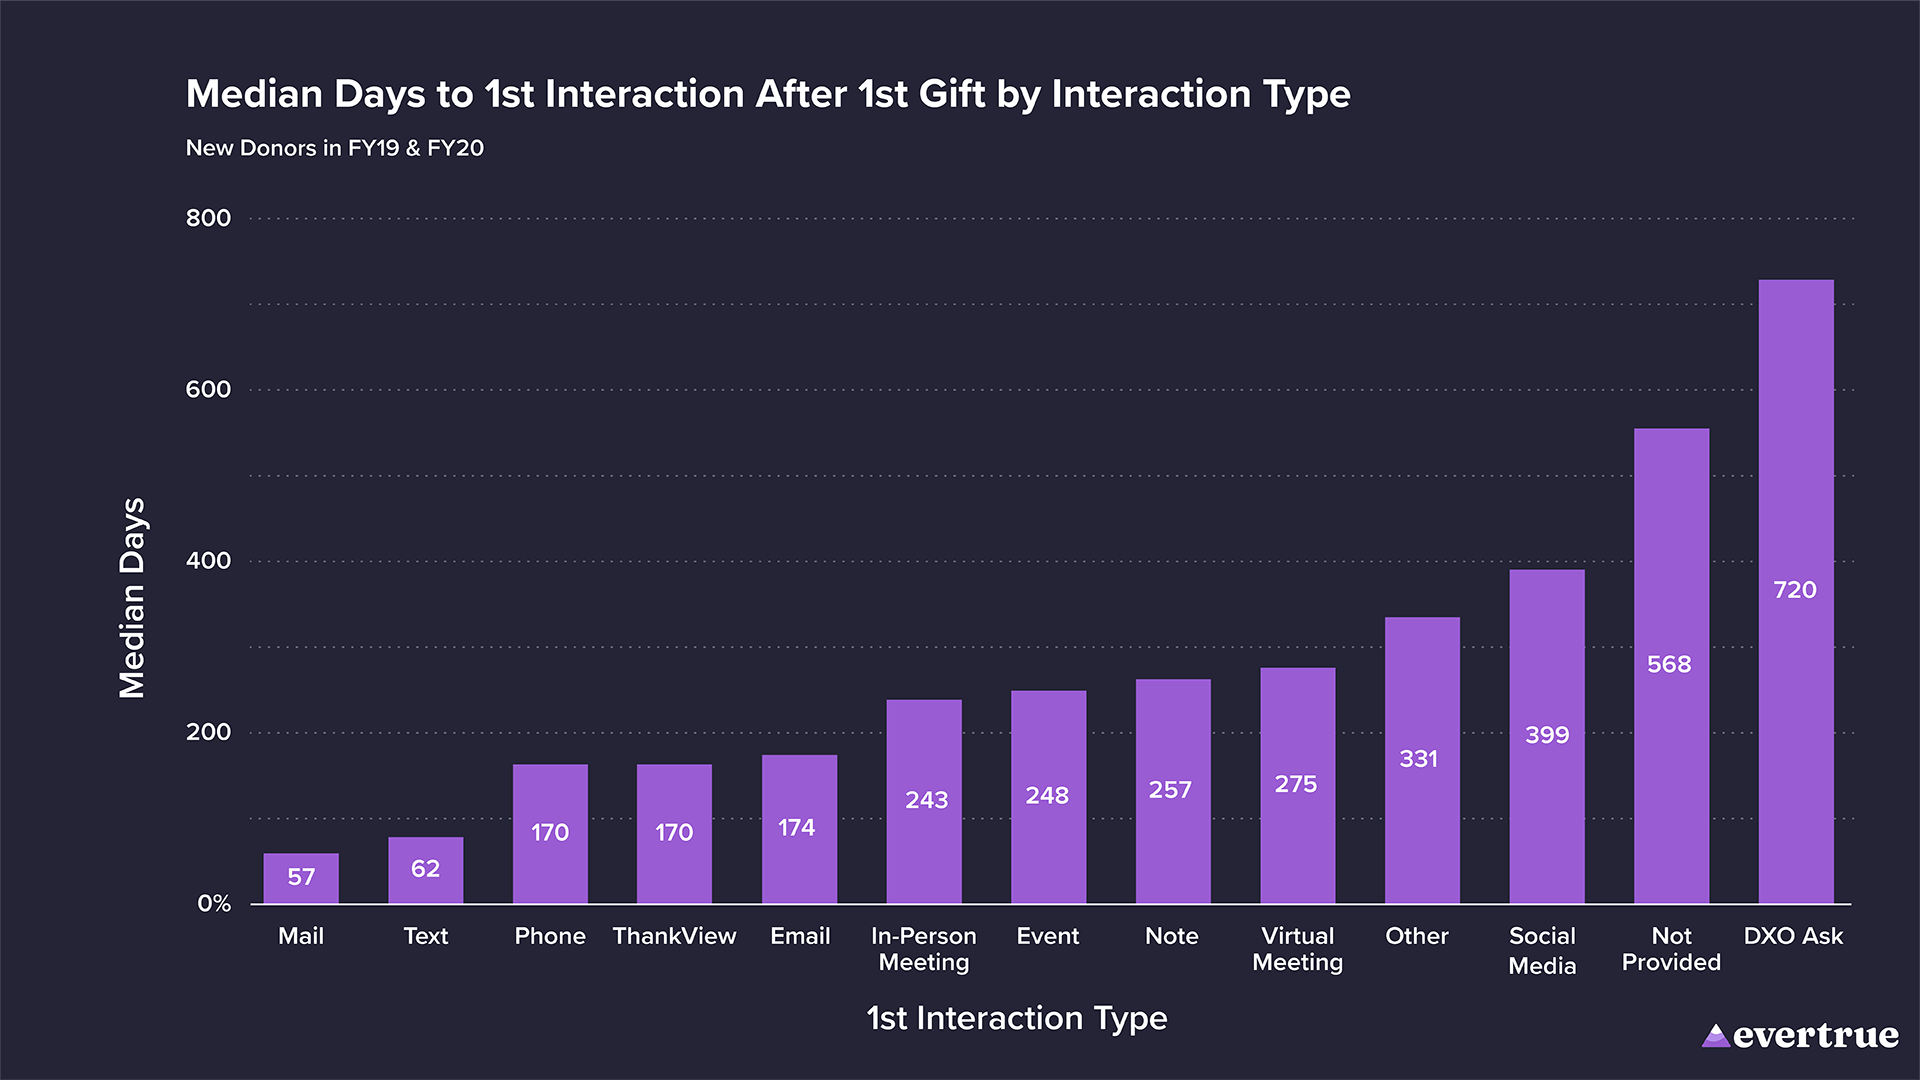
The chart above displays the median days between a first-time donor’s gift and the first interaction logged, categorized by interaction type. Notably, direct mail, often perceived as a slower, more traditional medium, had the shortest median response time, with interactions typically logged within 57 days of the initial gift. This suggests that many institutions prioritize a prompt follow-up through direct mail, possibly due to established processes that swiftly trigger acknowledgments and engagement through this channel.
Following closely behind is text messaging, with a median response time of 62 days. However, it’s important to note that the sample size for text interactions is quite small, with one institution contributing the majority of these entries.
Surprisingly, our research found that channels like email, video, and phone, which could theoretically offer immediate engagement, show a significantly longer median response time. The data indicates that interactions through these channels typically occur around 170 to 174 days, or almost six months, after the initial gift was made. This delay might be attributed to the fact that these channels, while efficient, may be underutilized in the immediate post-gift period or may be reserved for more personalized or strategic communications that require additional planning.
In addition, there’s a substantial increase in response time for other channels, such as in-person meetings, virtual meetings, and social media, where median response times range from 243 to 399 days.
The longest delays were observed in interactions categorized as ‘DXO Ask,’ which involve a cadence-based workflow designed to manage donor relationships. The median response time for this interaction type was 720 days. However, this is more reflective of the prospecting strategy than the immediate response time. In many cases, these donors were assigned to a Donor Experience Officer well after their first gift as a mitigation strategy to address the initial delay in contacting new donors promptly.
The chart below highlights the median response time between a first-time donor’s initial gift and the first interaction logged in the system, segmented by the amount of the first gift. The data reveals a clear trend: donors who contributed at a major giving level received a much faster follow-up compared to those who made smaller gifts. This discrepancy underscores the importance of prioritizing timely, personalized engagement, particularly with mid-level donors.
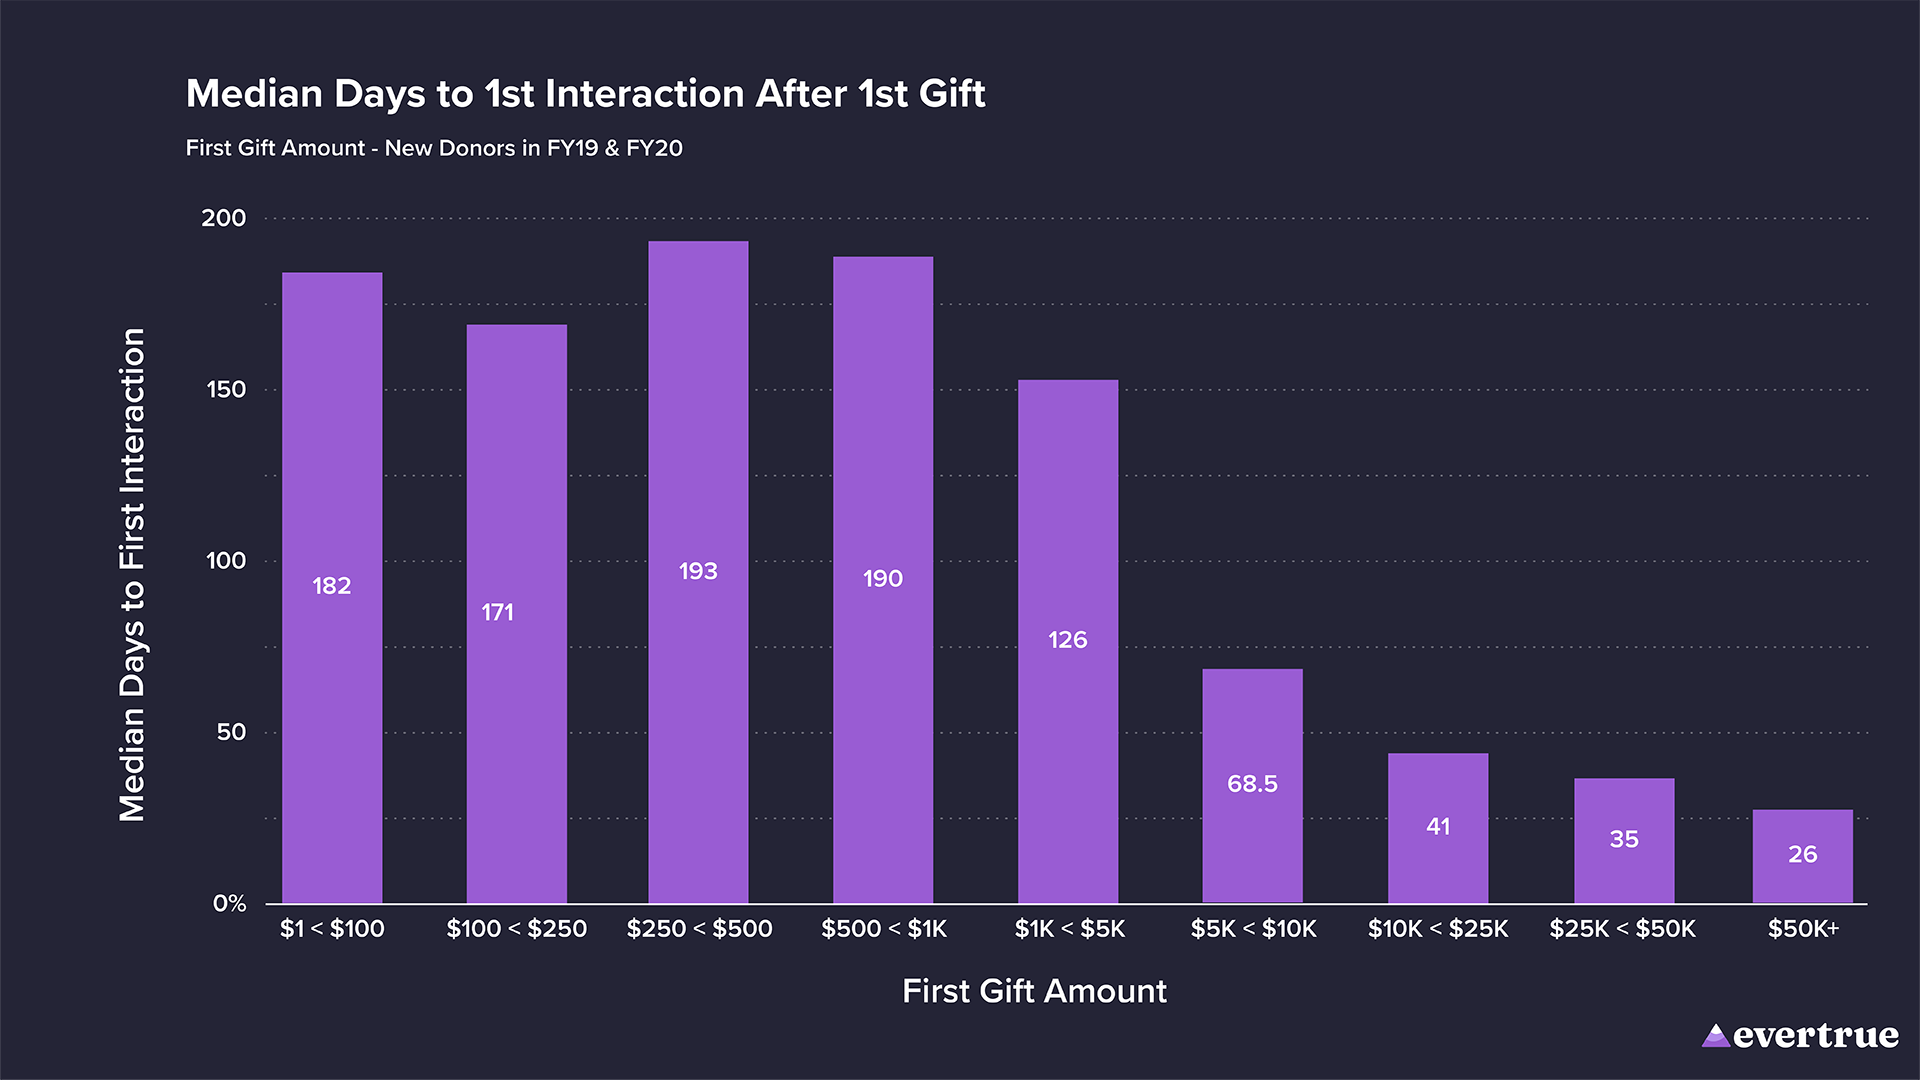
The rapid turnaround time for major gift donors is likely due to the fact that many of these individuals were already assigned to a major gift officer prior to making their contribution. This data shows the importance of engaging mid-level donors, as doing so could improve donor retention and satisfaction through better relationship-building.
However, the substantial delay in response time for donors who contributed less than $5,000 is concerning. While it may not be feasible for every institution to personally contact each first-time donor, the industry norm of nearly six months between a gift and personalized attention is simply too long. The expectation that smaller gifts would naturally receive less priority is understandable, but this data suggests that the gap is far too wide.
With the technological advancements available today, like Signal by EverTrue, which uses AI to streamline cadence-based outreach and automate tasks, there are many ways to ensure timely, personalized follow-ups without requiring extensive resources. The goal should be to reduce this response time significantly, regardless of the gift size. After all, many major gift donors begin their philanthropic journey with a first gift of less than $250. By setting a higher standard for response times, institutions can better nurture these relationships and potentially uncover future major gift donors earlier in the process.
The final chart in this section provides compelling evidence to support the notion that faster turnaround times between a donor’s first gift and the first interaction can significantly enhance retention rates. The chart illustrates the median days to the first interaction grouped by the time to the second gift: the first year, the second year, and the third year after their initial gift.
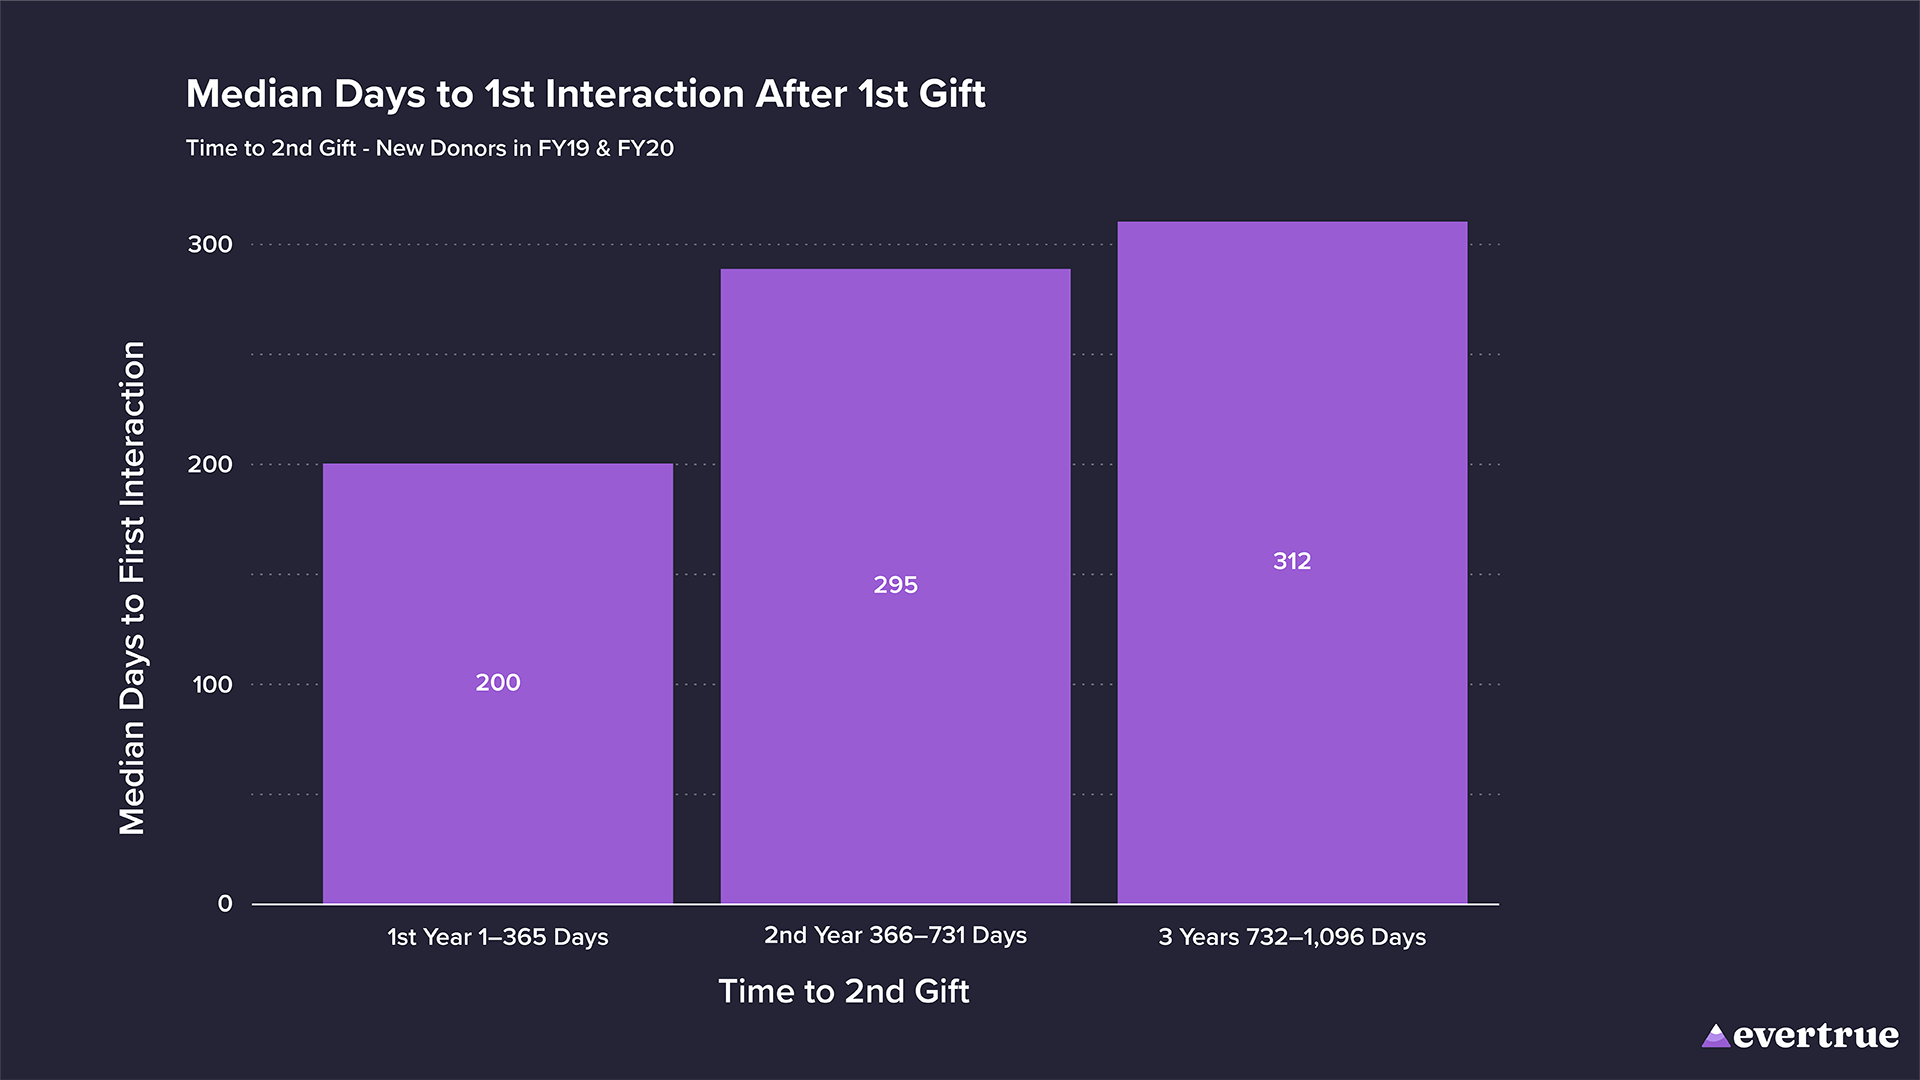
The data shows a clear trend: donors who renewed within the first year after their initial gift experienced the shortest median response time. This group, which boasted the fastest retention rate, underscores the critical role of timely and personalized follow-up. It also prompts a compelling question: could the retention rate within the first 365 days have been even higher if the response time had been reduced to 30 days or less?
As we move to donors who made their second gift during the second year, the median time to the first interaction extends to 295 days. While this is still an unreasonably long time frame, the delay likely contributed to a slower retention rate compared to the first-year renewals.
The longest response time is observed among donors who renewed during the third year after their initial gift, with a median of 312 days before the first interaction was logged. This group, having the slowest retention rate, highlights the critical impact of delayed engagement on donor retention.
This analysis supports the concept that quicker turnaround times between a donor’s first gift and the first personalized interaction are vital for improving retention rates. Institutions that prioritize timely follow-up, particularly in the crucial first year, are more likely to cultivate lasting donor relationships, ensuring that more first-time donors evolve into consistent supporters.
Key takeaways:
- Prioritize Timely Follow-Up: Focus on improving response times for follow-up interactions after a donor’s first gift. The data shows that quicker engagement, ideally within 30 days, can significantly enhance donor retention rates. By addressing this gap, institutions can nurture relationships and increase the likelihood of future contributions, especially from mid-level donors.
- Leverage Technology for Personalized Outreach: Utilize advancements like AI-driven tools to streamline and automate follow-up processes. With technologies such as Signal by EverTrue, institutions can ensure timely and personalized engagement without requiring extensive resources, ultimately leading to better donor experiences and higher retention.
Research Framework
The primary objective of this study was to understand the behaviors of first-time donors to higher education institutions, focusing exclusively on individuals rather than corporations or foundations.
The research population consisted of donors who made their first-ever lifetime gift between July 1, 2019, and June 30, 2021, with a cutoff date for inclusion set at June 30, 2024. These parameters provided at least four years to observe subsequent giving behaviors, allowing us to analyze donor retention patterns, the frequency of additional gifts, and the overall evolution of these donors over time.
The study analyzed data from 50 diverse institutions, resulting in a sample of 276,635 unique first-time donors and a total of 745,520 gift transactions. Among these transactions, 30% were first-time contributions, with the remaining 70% representing additional gifts from these donors after their initial giving event.
We focused on gift transactions that were not pledges. This selection criterion ensures that we are analyzing actual financial contributions rather than intended ones, providing a more accurate picture of donor behavior. To capture all forms of giving, we included soft credit gifts, which allowed us to account for contributions made through Donor-Advised Funds (DAFs) and other non-traditional giving mechanisms. This approach also ensured that differing gift crediting practices across institutions did not skew our results.
Transactions were grouped by day to ensure that multiple transactions logged during the same giving event were considered as a single transaction.
The accompanying bar plot illustrates the range of institution sizes within our study. Larger programs contributed more gifts to the sample, while smaller institutions contributed fewer. This diversity is critical, as it supports the notion that our findings are broadly representative of what is considered typical in the industry.
A Note on Support
Interpreting data visualizations can sometimes be challenging, especially when dealing with new types of plots. If you have questions or need further clarification on how to interpret the charts and findings in this report, EverTrue staff are always available to assist. We are happy to connect with you for a conversation about the data and help you gain a deeper understanding of the insights presented.
You made it to the end! Thank you for taking the time to read our 2024 First-Time Donor Report. We hope you found the insights as enlightening and valuable as we did.
To learn more about how EverTrue leverages AI to make stewarding your entire donor pyramid (including those first-time donors) easier, book a demo today.